Because the Heikin Ashi candlesticks are measured using averages, they would have smaller shadows (wicks) than a standard Japanese candlestick. Keep reading to find out more about Heikin Ashi, candles, strategies, charts, traders, and Heikni vs candles. This article gat you covered, let’s proceed.
Heikin Ashi
Heiken Ashi, is a Japanese word that means “average bar.” However, when trading stocks, the Heikin-Ashi method can be used in combination with candlestick charts to spot market patterns and forecast future prices. It’s useful for making candlestick charts easier to read and analyzing patterns.
Traders may use Heikin-Ashi maps, for example, to determine when to remain in trades. While the trend continues but exits when the trend pauses or reverses. The majority of profits are made while markets are trending, so correctly predicting patterns is critical.
The smaller (or shorter) the shadow (or wick) on a Heikin Ashi candlestick, just like with standard Japanese candlesticks, the greater the trend. Meanwhile, the green candles with no lower shadow signal a strong UPTREND. However, the red candles with no upper shadow signal a strong DOWNTREND.
Heikin Ashi Candles
Heikin Ashi is a charting technique that resembles a typical Japanese candlestick chart at first glance. However, the process by which candlesticks are measured and plotted on a map differs.
Japanese candlesticks will help you find good entry points since they display possible reversals (like a shooting star) or breakouts. But, hold on, what about once you are already in the trade?
Discover: DIAMOND PATTERN: Understanding the Diamond Chart Pattern(+Quick Guide)
When applied to a price map, the Heikin Ashi technique will help you determine whether to stay in or exit a trade. A time series separates a series of open-high-low-close (OHLC) candles in a traditional candlestick chart. However, the Heikin-Ashi technique has some similarities to traditional candlestick maps, but it employs a modified close-open-high-low (COHL) formula.
Heikin Ashi Strategies
The following are some Heikin-Ashi strategies that traders can use to boost their profits and margins. Meanwhile, understand money management for your profits and margins.
- A Strong Bullish or Bearish Trend Is Forming
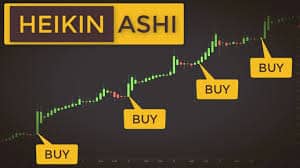
This is the most popular Heikin-Ashi strategy, which is to recognize the start of a powerful uptrend or downward trend. Heikin-Ashi signal indicators are generally thought to be very accurate and are only rarely incorrect.
As a result of the Heikin-Ashi trend signal’s reliability, traders will profitably ride the trend. Traders with short positions should exit if a bullish pattern emerges, whereas those with long positions should raise and stabilize their positions.
Read Also: FINANCIAL MARKET: All you should know with Practical examples (+ free pdfs)
- Candlesticks with no shadows are easy to spot
Finding candlesticks with no shadows is a reliable indicator that a powerful bullish trend is about to begin. Because of its track record and high success rate, this strategy is one of the most common Heikin-Ashi strategies. Moreover, the higher the predicted pattern, the longer the sequence of candlesticks with no tails.
- Trend pauses or reversals are indicated by candlesticks with small bodies
Traders should be mindful of and pay attention to the appearance of candles with tiny bodies. When a pattern is about to pause or reverse, these candles are used to signal it. As a result, when traders see this, they respond by opening new positions in response to the trend ending.
Learn: Reverse Merger Stocks: Overview & Examples
In addition, traders should exercise caution, as the pattern could be pausing rather than reversing. In that case, the trader must use skill to decide whether a trend reversal is imminent or simply a trend pause.
Heikin Ashi Charts
During a downtrend, the Heikin-Ashi chart candles are normally red, while during an uptrend, they are orange. Different color variations, on the other hand, have been known to be used. A shift in the color of the HA candle indicates a possible pattern change.
The Heikin-Ashi chart has smoother lateral moves and more consecutive bars of the same hue, providing a better image of price movements. Meanwhile, the chart differs from the conventional candlestick chart in a few ways.
Read Also: 5 Internet business consultant for your online business
Basically, traders find it difficult to understand and recognize patterns as the conventional candlestick chart pattern switches colors from green to red and vice versa. Perhaps, the Heikin-Ashi map eliminates noise by displaying consecutive colored candles. Which makes it much easier to read and spot previous price fluctuations and current trends.
Deeper Explanation
It’s also worth noting the price scale. On a standard candlestick map, the current price of the asset is also the current price of the asset, which corresponds to the candlestick’s closing price (or the current price if the bar hasn’t closed). However, since Heikin-Ashi takes an average, the current price on the candle does not reflect the current market price. As a result, several charting platforms show two prices on the y-axis: one for the Heiken-Ashi estimate and another for the current asset price.
When applied to a price map, the Heikin Ashi technique will help you determine whether to stay in or exit a trade. On the other hand, for traders who want to know when to remain in trade and ride a strong trend and when to get out when the trend weakens, AH charts make candlestick charts more readable.
Discover More: Financial Times: History, Subscription, News (+ Free Sub Tips)
It is a tweaked candlestick charting technique that rearranges how the price is shown to give trend traders more trust when deciding whether to stay in or exit a trade.
Its charts are an alternative to conventional Japanese candlestick charts used by certain traders, typically longer-term traders.
Meanwhile, others combine them with standard Japanese candlestick maps, going back and forth between the two.
Heikin Ashi Traders
How do you trade Heikin Ashi as a trader?
Using a Heikin Ashi map, as previously described, makes it easier to spot patterns. It enables traders to watch for the advent of new patterns or the reversal of old ones.
A trader can use Heikin Ashi charts in five different ways in trading, let’s take a look at them each.
You May Also Read: PENETRATION PRICING POLICY: HOW YOU CAN GAIN MARKET ENTRY
#1. Green candlesticks signal an uptrend
When the Heikin Ashi candle turns green (bullish) from red (bearish), it indicates that the price is about to turn higher.
- You may want to exit if you’re currently in a short spot.
- If you’re in a long place right now, you may want to add to it.
Learn: DONCHIAN CHANNEL: How To Use Donchian Strategy Effectively (+Simple Beginner Guide)
#2. Green candlesticks with no lower shadow or wick indicate a strong uptrend
A clear uptrend can be seen if there are a lot of green shaved bottoms. Just follow these steps below:
- Last, as long as you can until the color of the Heikin Ashi candlestick changes from green to red.
- Allow your profits to run while riding the uptrend as long as no lower shadows appear.
#3. Candlesticks with small bodies showing upper and lower shadows indicated a possible trend reversal (or trend pause)
Since the latest trend might be coming to an end, open a spot on the opposite side of it. Keep in mind that changing the color of the next candlestick does not necessarily indicate the end of a trend; it may simply be a pause.
Consider: Penetration Pricing Strategy: Guide for Emerging Markets
#4. Red candlesticks identified a downtrend
When the Heikin Ashi candle turns red (bearish) from green (bullish), it indicates that the price is about to fall.
- If you’re currently holding a long spot, you should consider exiting.
- Perhaps, you’re currently in a short spot, you might want to consider expanding it.
Read Also: MARKET GROWTH: Definition, Calculations, Rates, Strategies (Simplified)
#5. Red candlesticks with no upper shadow or wick indicate a strong downtrend
Have you noticed how many people have their heads shaved red? That’s a significant downward trend.
- Keep it short until the color of the Heikin Ashi candlestick shifts from red to green.
- Stay short and ride the downtrend as long as there are no upper shadows, then take your money.
Discover: MARKET RISKS: Best Practices and Easy Guide with Examples
Heikin Ashi vs Candles
Traditional Japanese candlestick charts’ candles often change color from green to red (up or down), making them difficult to read. Candles on the Heikin Ashi map, on the other hand, show more consecutive colored candles, making it easier for traders to recognize past price movements.
You’ll find that the candles on Heikin Ashi charts appear to remain green during uptrends and red during downtrends. Traditional Japanese candlesticks, on the other hand, alternate colors even if the price is strongly heading in one direction.
Read More: What Is Below-the-Line Advertising: Definitions, Examples, Marketing Ideas
It candles are preferred by some forex traders because they reduce chart noise. As well as enable them to analyze trends more clearly.
The way the price is shown in terms of the open and close distinguishes Heikin Ashi from a standard Japanese candlestick map. On the other hand, the candlesticks work in this way because of the way they are measured.
Discover: TRADE ZERO Review 2022: Is The Broker Legit or Scam?
Heikin-Ashi Formula
Open-high-low-close (OHLC) candles are a common component of candlestick charts, and they are separated from one another by a time series. While using a modified version of the close-open-high-low (COHL) formula, the Heikin-Ashi approach has certain similarities to traditional candlestick charts.
Close=41 (Open+High+Low+Close)(The average price of the current bar)Open=21 (Open of Prev. Bar+Close of Prev. Bar)(The midpoint of the previous bar)High=Max
[High, Open, Close]Low=Min[Low, Open, Close] Investopedia
The Heikin-Ashi Technique’s Drawbacks
A trade setup takes longer to create with the Heikin-Ashi method since it uses price data from two periods. For swing traders who have the patience to let their transactions play out, this is typically not a problem. However, Heikin-Ashi charts might not be responsive enough for day traders who need to take advantage of swift price movements.
Additionally, the averaged data hides crucial price information. Many traders believe that daily closing prices are crucial, however, a Heikin-Ashi chart does not show the actual daily closing price. Only the averaged HA closing value is displayed to the trader. The trader must be aware of the actual price as well as the HA averaged values in order to manage risk.
Price gaps are another crucial aspect of technical analysis that is absent from Heikin-Ashi charts. Many traders make use of gaps to assess price momentum, establish stop-loss levels, or initiate trades.
Is Heikin-Ashi reliable?
It is a highly dependable indicator that produces accurate readings. It makes use of historical data, which is also quite trustworthy. Filtering of market noise: The indicator lowers minor adjustments and filters out market noise, resulting in more visible signals.
Do traders use Heiken Ashi?
Technical traders can more quickly recognize a trend by using the Heikin-Ashi method. Strong uptrends are indicated by hollow white (or green) candles with no lower shadows, and strong downtrends by filled black (or red) candles with no upper shadow.
Is Heikin-Ashi good for day trading?
Whether day trading or swing trading, Heikin Ashi is helpful for short-term trading methods. Any market, including forex, equities, commodities, and indices, can use it. This style of chart and indication can aid a trader in identifying trends and maintaining profitable positions.
Which Indicator Is Best With Heiken Ashi?
The Heikin-Ashi is a trend indicator, hence other trend indicators should be used to amplify its indications. Among the most dependable trend indicators that can assist you in getting a definite signal are moving averages and parabolic SAR. To get stronger signals, combine Heikin-Ashi with other indicators.
Which Candle Pattern Is Best?
The Five Most Effective Individual Candlestick Patterns
- Doji.
- Dragonfly Doji.
- Gravestone Doji.
- Spinning top.
- Hammer.
Is Heikin-Ashi Lagging?
A Heikin-Ashi chart is comprised of close-open-high-low candles, but the calculating factors are far more complicated than those of traditional candlesticks. Heikin-Ashi is typically more sluggish than conventional candlesticks, and its signal tends to lag behind real-time, similar to the Moving Average indicator.
Do Professional Traders Use Heiken Ashi?
Once a trade begins, the majority of traders will employ Heikin Ashi candlesticks to stay in the trade far longer, preferring not to adjust their position or exit until the candlestick changes color.
Conclusion
When a pattern starts, the Heikni Ashi techniques can be used to hold a trader in the trade. It’s better to remain in a trade until the candles turn a different hue. A shift in color doesn’t necessarily indicate the end of a trend; it may simply signal a pause.
Related Articles
- Are candlesticks enough for trading – what does the new Elite CurrenSea guide teach us?(Opens in a new browser tab)
- PSYCHOGRAPHICS: Best Practices & All You Need To Know, Simplified!(Opens in a new browser tab)
- GOLDEN CROSS STOCK: 5 Simple Steps to Applying the Golden Cross Trading Strategy(Opens in a new browser tab)
- HOW TO BECOME A DAY TRADER: Step-by-Step Guide(Opens in a new browser tab)