Many forex traders have been using simple price patterns not only in forecasting profitable trading opportunities but also in explaining simple market strategies. Although, not all are conversant with the structure or trading pattern. Let’s dive into the diamond pattern. This article is a complete guide to understanding diamond chart patterns, stock, and its trading strategies.
Diamond Pattern
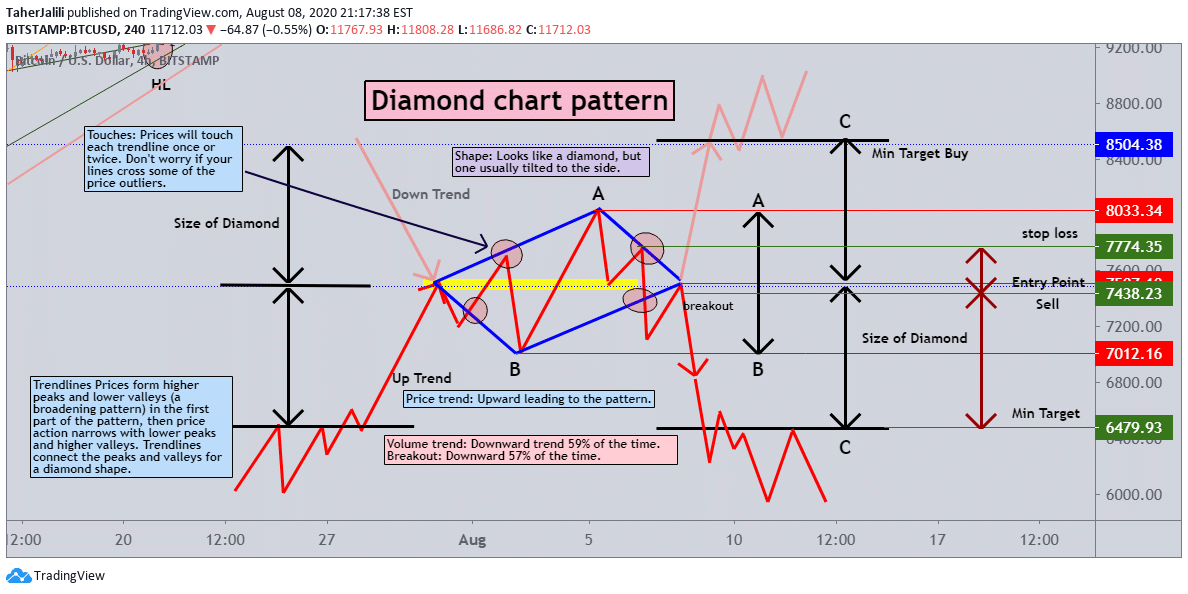
A diamond pattern is an advanced chart formation that occurs in the financial markets used for detecting reversals. It is one of the trading strategies for profitable patterns of reversals. Its occurrence is most often after a prolonged trend phase. Therefore, when it occurs within the context of a bullish market, it is referred to as a diamond top, or a bearish diamond pattern. Also, if it occurs within the context of a bearish market, it is referred to as a diamond bottom or a bullish diamond pattern.
Importance
A diamond pattern trading revolves around investor psychology. This pattern looks at a very specific way of taking traders on how the stock behaves.
After a large movement, investors are eager either to take profits bullish or to short bearish. This causes the first round of consolidation. Thus,
there’s a period of instability that investors are strengthened by some volumes. The pullback is another consolidation that destabilizes the price. Then the final breakout occurs when investors capitalize on the current level.
Diamond Chart Pattern
The diamond chart patterns are sometimes muddled with the head and shoulders chart pattern with a v-shape neckline. They usually happen at market tops, although with some similarities between the formations. It can also be identified as an extraordinary pattern that is occasional in nature.
This chart reversals mostly occur at major tops with high volume and also rarely at market bottoms. It most often occurs at major tops and with high-volume. However, a breakout from diamond chart formation may later carry stocks. However, unlike the commonly seen pennant, head and shoulders, flags, and rectangle patterns, the diamond chart pattern occurs less frequently on the price chart.
Diamond Pattern stock
Diamond stock patterns are an important tool in trading. There is a need to utilize it as part of your technical analysis strategy. They play an integral part when seeking market trends and predicting movements. However, they can be used to analyze all markets including forex, shares, as well as commodities. These stock chart patterns are ways of viewing series of price actions that occur during a stock trading period. It can occur over any time frame but the most thing about is that they repeat itself overtimes.
Besides, stock chart patterns are the most common diamond chart patterns to look out for when using technical analysis to trade the financial markets.
Diamond Pattern Trading
You can agree with me that it’s not easy to begin diamond pattern trading. This is because the shape requires a sharp eye and consistent practice. It often leaves traders at a guess at when to enter or exit a position. Therefore, you need a strong and accurate approach is to spot this pattern correctly. These patterns rare, meanwhile, they are often breaking up or down regardless of bullish or bearish indicators.
Meanwhile, trading chart patterns often form shapes, that helps predetermine price action, such as stock breakouts and reversals. If you can recognize these chart patterns it will help you gain a competitive advantage in the market. Note that it is important to familiarise yourself with the different types of trading charts. Don’t start a chart pattern analysis you aren’t too sure about.
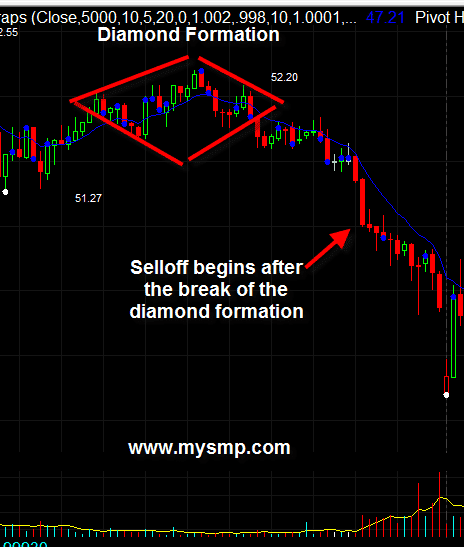
When the price breaks the right base of the diamond which is also a dynamic support line is a perfect starting point. As such this breakout confirms that the trend reversal.
An important thing you should consider about diamond pattern trading is;
- Not to trade against it until it shows you a definitive break.
- The trend could be bearish, but the break could also be bullish,
- Or the trend might be bearish while the break reduces.
Therefore every pattern trader needs to know the basics of a diamond pattern.
Read Also: Trading Deep In The Money Options- Risks to consider
Diamond Pattern Trading Mistakes
The biggest mistake a trader can make is trading diamonds too early. Ensure to draw support resistance lines and treat the second half of the diamond like a symmetrical triangle. Whenever, the price breaks above or below either threshold, it gives signals on the direction of the impending price movement.
Another risk in trading a diamond is setting price targets and stop-losses. I suggest there is no technical way to evaluate how high or low a diamond’s break could be. This is because many traders are sometimes too conservative in benchmarking.
Although most traders often calculate the difference between the high and low points of a diamond and then add it to the breakout. Hence the best option is to examine the initial drop that started the diamond using market momentum in predicting the correction level after the break.
Related Articles:
- Types of Market Segmentation (+ Benefits, Tips & Examples)
- FINANCIAL MARKET: All you should know with Practical examples (+ free pdfs)
- Free Example of a Business Plan
- Market Profile: What you need to know simplified & explained
- SHORT CALL: Best easy guide to master short call strategy
Summary
When you want to In identifying the best entry points for your transactions chart patterns makes it easier. Independently, It can yield you good profit with quite a small risk. It does not often appear on the chart. In addition, they are observed after a strong price movement. Also, try to verify the existence of a diamond shape on the chart.
Oftentimes, most diamond chart reversals occur at major tops and with high volume rarely at market bottoms. You can notice diamond bottoms in a bull market with an upward breakout, whereas for overall performance those in a bear market always come second.
Disclaimer!
Pieces of information contained in this article are not investment advice. However, references to price movements and trend levels are informational base on external analysis. We do not warrant that any such movements or levels are likely to reoccur. Therefore consult an expert for more directives.