Do you know that trending instruments such as futures, cryptocurrencies, etc can work well with the Donchian Channel? Get ready I’ve got you a roadmap to Successful trading, and details on how some traders use the donchian channel. This article is a guide on how to use the donchian channel, its strategy, MT4 & MT5 channels as well as donchian channel vs Bollinger bands.
What is Donchian Channel?
The Donchian channel was developed by Richard Donchian “Father of Trend” in the mid-twentieth century. They are three lines generated by a moving average calculation comprising an indicator formed by upper and lower bands around a mid-range. However, the area between them is the channel chosen for the period. This was to help him identify trends in market trading. Thus it is commonly available on most trading platforms.
Also, It calculates its prices by using a default 20 bars of data. allowing, traders to use shorter or longer Donchian Channels according to their trading strategy. Donchian Channel is also called “The 4-week rule”because of the default length of four trading weeks.
The calculation formula of Donchian Channel indicator suggests that the Donchian Channel revolves around establishing a relationship between the current price. Its trading also ranges over a chosen timeframe. The three values that are calculated build a visual map on the charts illustrating its prices over the predetermined periods.
Importantly, it makes it easy for the traders to identify bullish and bearish trends over that period of time. Therefore, traders can also use the Donchian Channel indicator to measure the volatility of the market and identify breakouts.
How do you Calculate Donchian Channels?
This indicator is usually calculated in a very simple but way. Although, as earlier mentioned, its functioning is based on three bands that are plotted on the chart. They both are the lowest low and the highest high while the middle band is sandwiched between the two outer bands. Here is the effective formular to calculate donchain channels.
Note: The (n) is the number of periods that you decide.
lower channel (LC) = The lowest low for the last n-periods
middle channel (MD) = The average of the lower and upper channel for the last n-periods (UC – LC / 2)
Upper channel (UC) = The highest high for the last n-periods
Moreover, most traders prefer the default 20-period setting. You can also choose any timeframe ranging from minutes to hours or weeks. However, remember that the best setting varies depending on the chosen timeframe and the trade market.
How to use Donchian Channel indicator
This indicator works purely on the prices and does not try to guess any support and resistance areas. Thus, it is the greatest strength of the Donchian Channel indicator. Its trend-following trait guarantees that the traders remains on the right track. Lets get to the prices.
Firstly, the donchian channel is definitely not a complex tool, but it may be deceiving. It’s important to know that it does not calculate anything, rather, it gives a better visual representation of the data. Donchian channel’s usage in trading is done by giving large timeframes, although in most cases, traders rely on the 50-day timeframes for understanding the trend better.
- The first one is when the prices cross the highest high or the upper band.
- The second is when the prices cross the lowest low or the lower band.
Technical analysts should enter a long position when the Donchian Channel indicator generates the upper band crossing signal, then sell when the lower band is crossed.
It will interest you to know that during an uptrend, the upper band is taken higher with the arrival of new highs. Similarly, new highs also have higher lows making the lower band move higher too. Equally important, this is one reason that long exits are fruitful for the traders during the longer trends.
Similarily, traders can also use it to measure the volatility of the market for their particular trading strategy. The volatility level in market is a key difference between the upper and lower band for the predetermined period.
Pros and Cons of Donchian Channel indicator
Although, the trading market is always risky forums to do business but a lot of trading tools have been in use years. Yet they have not been able to curtail the level of risk. Every technical analysis tools comes with its advantages and disadvantages which must be taken into consideration before opting to employ any trading tool.
Pros
- You can easily know the volume of the market by calculating the difference between the upper and lower band of the past n-periods.
- They are trend-follower indicators that rely on the actual data.
- It helps to capitalize on the momentum of the market by following the trend.
- It is a versatile indicator that works well with all timeframes such as hours, days, weeks, etc.
- They can be used in different trading markets such as futures, options, stocks, forex, cryptocurrencies, etc.
Cons
- It is not always easy to trade the market for beginners because it may be a bit hard to use it effectively.
- If the trends do not go long, the traders cannot exit the market profitably because price movement is not enough to jump out of the market with profit
- It may generate false signals when prices move sideways.
Donchian Channel Strategy
The Donchian trading strategy is more or less an intraday trend with a strategy that allows you to profit from it.
Besides, It’s important to understand the characteristics of an intraday trend and long-term trends. Therefore, in this regard, below is the best Donchian channel trading strategy with a proprietary trading pattern.
#1. Breakout Trading Strategy
It is a short to medium-term donchian channel trading strategy that allows a trader enters a chosen trend as early as possible with the expectation that the security price will break through the upper or lower band. This simply means a breakout from its current trading range respectively through a bullish or bearish trend. Follow the link above for more information.
#2. Reversal Trading Strategy
This strategy allows a trader to wait for a reversal trend to occur from the current trend before taking a long or short position. Moreover, this depends on the reversal trend.
Although Donchian channel looks similar to the Bollinger Bands, but they are different. The Donchian channel trading strategy offers you a unique way of spotting trends with an outstanding risk for ratios rewarding.
Donchian Channel MT4
The donchian channels MT4 indicator is a useful indicator that illustrates the range of volatility of the market within a given period of time. It also plots the highest and the lowest prices. However, if the volatility is less therefore the channel is narrow.
You can indicate an uptrend by the closing of the currency pair above its highest level, while the downtrend is also indicated by the closing of the currency pair below its lowest level.
In order to transform accumulated history data, install a Donchian Channels Meta Trader (MT4)
Also, Donchian Channels MT4 allows you to detect several changes and dynamics in price that many traders can’t estimate without an indicator.
Thus, with the Donchian Channels, MT4 traders can draw conclusions and make estimates about how prices will change base on the information they”ve got. Then they can modify their strategy for better trading. While the Donchian Channels Indicator For MT5 is a multi-dimensional market analysis tool that serves as a trend gauge as well as a volatility barometer.
Donchian Channel MT5
Donchian Channel MT5 is an implementation of a well-known channel also developed by Richard Donchyan. Its calculation is base on the highest high and lowest low of the recent X candles. Therefore, with this channel, you can also see the direction of the trend. The Donchian Channels Indicator For MT5 is another multi-dimensional market analysis tool that can both serve as a trend gauge as well as a volatility barometer.
The Donchian Channel volatility indicator for MT5 draws a channel, the upper channel represents the 20-day high price while the lower channel the 20 day low price. Therefore, a trader needs to understand the overall trend first then use the Donchian channels to trade a breakout in the direction of the overall trend towards the higher highs or lower lows.
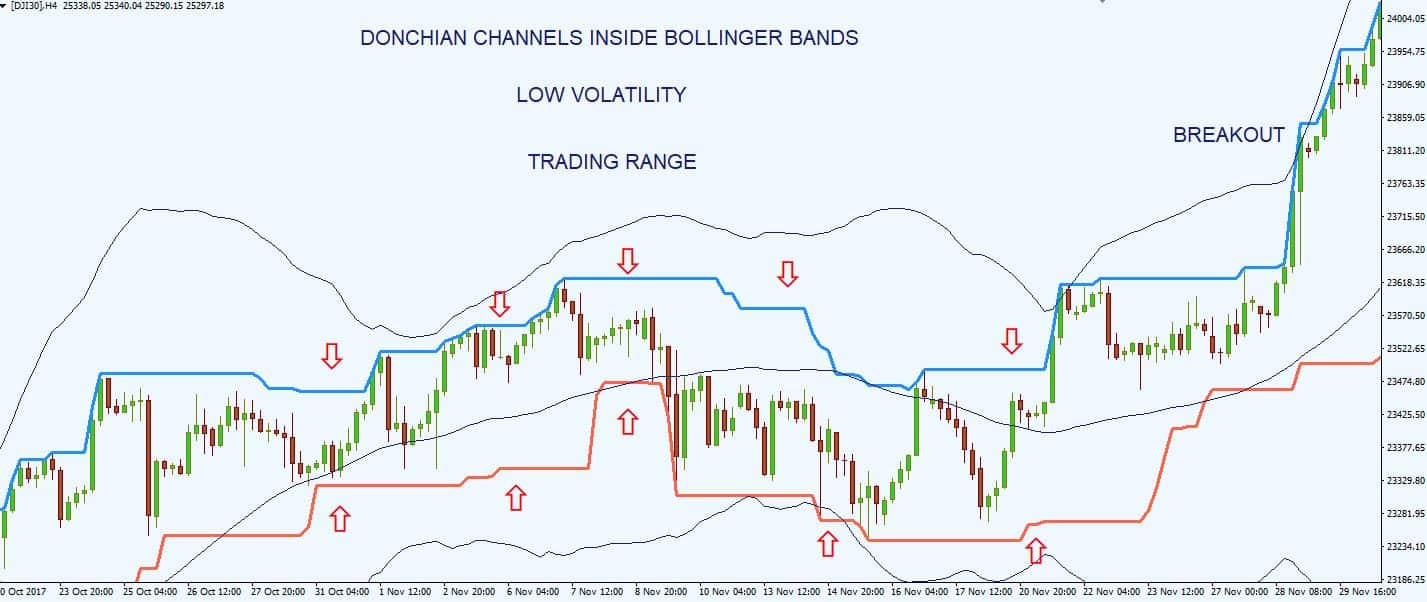
Donchian Channels vs Bollinger Bands
- The key difference between the Donchian Channels vs Bollinger Bands is that the Bollinger Bands depend on the standard deviation from the average, whereas Donchian Channels represent volatility at high and low prices. :
- Donchian Channels plot the highest high and lowest low over N periods where Bollinger Bands plot a simple moving average (SMA) for N periods plus/minus the standard deviation of price for N periods X 2. This calculation reduces the impact of big high or low prints.
- Another great difference between Donchian Channels vs Bollinger Bands is that Bollinger Bands take into account the volatility of the markets and adjust accordingly. Whereas, the Donchian Channel is fixed based on a period’s highs or lows.
Hence below are other differences between Donchian Channels vs Bollinger Bands :
#1. Indicator Calculations
Donchian Channels record the top highs and lowest of lows of prices over a specific timeframe. The Bollinger Bands in contrast show the difference between the two standard deviations from an SMA of the price information of a given period.
#2. The Relationship Between the Bands
The upper and lower bands in the Bollinger Bands are gotten by using the middle line of the indicator.
- Middle Channel+ 2 Standard Deviations+ Upper Channel
- Middle Channel- 2 Standard Deviations= Lower Channel
- (Upper Channel-Lower Channel) divided by 2= Middle Channel
The reverse is the case for For Donchian Channels. The middle band is calculated by taking stock of the average of the lower and upper lines:
#3. Interpretation of Breakout
Whenever the price breaks out of the lower or upper channel, it gives a different interpretation. Besides, in Bollinger Bands, a break outside the lower or upper band shows the potential for the trend to reverse. Additionally, a price breakout over the upper band also indicates that either the market is overbought and will eventually revert but if the asset price breaks under a lower band, it shows that the prices have dipped a lot.
Related Articles:
- Integrated Marketing Communications: The Complete Guide (Simplified)
- Financial Performance: A Comprehensive Guide For Any Business(+ quick tools)
- Balance of Trade (BOT): Definition, Components, and Calculations
- Implied Volatility (IV): Formula and Calculator (+detailed steps for calculating IV)
- SOCIAL MEDIA MARKETING STRATEGY 2020: A detailed guide(+free template)
Conclusion
As earlier discussed, the Donchian Channel indicator measures volatility to determine the overbought or oversold market conditions. It is also important to validate your trading strategy before taking any action. This is because you cannot be absolutely sure about the reaction of your trading market and timeframes. Therefore, take advantage of this indicator as it can work well with other indicators such as the Directional movement. The directional movement is a combination of the Donchian Channel indicator with any other indicator that increases the odds of maximizing gains.