
Implied volatility is one of the first principles that new options traders can understand (IV). Since IV reflects the market consensus on what the underlying instrument’s price volatility will be, it is a critical concept to grasp. Generally, the higher an option’s IV, the more expensive or higher the premium a seller can charge for that option, and vice versa. So let’s see how to calculate Implied Volatility with the formula and get an overview of the calculator.
What Is Implied Volatility (IV) and How Does It Work?
Implied volatility is a statistic that captures the market’s perception of the probability of price fluctuations in a specific direction. Investors may use it to forecast future movements as well as supply and demand. Investors also use it to price options contracts.
Historical volatility, also known as realized volatility or statistical volatility, is not the same as implied volatility. The historical volatility figure would take into account previous market shifts and their real outcomes.
Recognizing Implied Volatility
The market’s prediction of a security’s price change is known as implied volatility. Hence, investors use it to forecast future market changes (volatility) based on certain predictive factors. Implied uncertainty, denoted by the symbol (sigma), is often used as a metaphor for market risk. Over a given time frame, it is generally expressed in percentages and standard deviations.
In the stock market, implied volatility rises in bearish markets, as investors expect share prices will fall over time. When the market is bullish and investors expect that rates will increase over time, IV falls. The majority of equity investors perceive bearish markets to be unfavorable, and thus riskier.
The implied volatility does not predict the course of the price transition. High volatility, for example, indicates a big price swing, but the price could swing upward—very high—or downward—very low—or fluctuate between the two directions. Low volatility indicates that the price is unlikely to adjust dramatically and unexpectedly.
What is the formula for calculating Implied Volatility?
Implied volatility is a significant parameter and a necessary aspect of the Black-Scholes model, which is an option pricing model that provides the option’s market price or market value. So, the formula should show where the volatility of the underlying in question should be in the future and how the market perceives it.
By using the black and Scholes formula for reverse engineering, one does not quantify the value of the option but rather takes feedback such as the market price of the option, which is the intrinsic value of the opportunity. The volatility must then be calculated by working backward. The volatility implicit in the option price is thus the implied volatility. One can do the calculation using the implied volatility calculator.
C = SN (d1) – N (d2) Ke -rt
Where C denotes the Option
The stock price is denoted by Premium S.
K is the Strike price
r is the risk-free rate.
t is the time to maturity.
The exponential term is e.
NOTE: To measure implied volatility, use the above formula backward.
Read Also; IV Crush: Implied Volatility Crush Overview (+ tips on how to avoid them)
Implied Volatility Calculation (Step by Step)
The following measures can be used to calculate implied volatility:
Step 1
Gathered the Black and Scholes model inputs, such as the market price of the underlying. This may be a stock, the market price of the option, the strike price of the underlying, the time to expiration, and the risk-free rate.
Step 2
Now enter the above data into the Black and Scholes Model.
Step 3
After completing the preceding steps, begin an iterative search based on trial and error.
Step 4
One may also perform interpolation on data that is close to the implied volatility to obtain an estimate of nearby implied volatility.
Step 5
This is not an easy calculation because it necessitates treatment at each point.
Example 1
Assume the at-the-money call price is 3.23, the underlying’s market price is 83.11, and the strike price is 80. If the risk-free rate is 0.25 percent, the expiration date is just one day away. You must compute the implied volatility based on the information provided.
The solution
To measure estimated Implied Volatility, we can use the Black and Scholes formula shown below.
Calculate implied volatility using the data given below.
3.23 is the value of a call option.
83.11 is the current stock price.
80.00 is the strike price.
0.25 percent risk-free rate
Ke -rt = SN (d1) – N (d2)
3.23 = 83.11 x N(d1) – N(d2) x 80 x e-0.25% *1
Using an iterative and trial-and-error procedure, we can calculate Implied Volatility at 0.3, where the value is 3.113, and at 0.60, where the value is 3.24. As a result, the Vol ranges between 30% and 60%.
Method of Trial and Error – Call Price at 30%
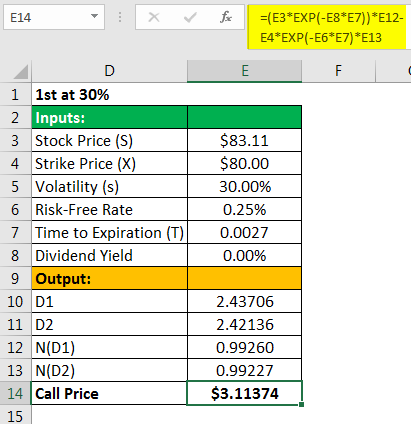
=$83.11*e(-0.00%*0.0027))*0.99260-$80.00*e(-0.25%*0.0027)*0.99227
=$3.11374
Trial and Error Method – Call Price at 60%
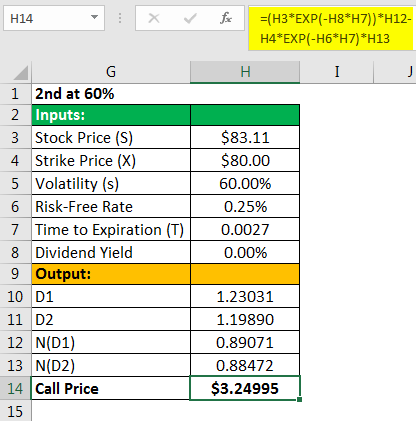
- =$83.11*e(-0.00%*0.0027))*0.89071-$80.00*e(-0.25%*0.0027)*0.88472
- =$3.24995
We can now use the interpolation method to compute the implied volatility at which it must exist:
- = 30% + (3.23 – 3.11374)/ (3.24995 – 3.11374) x (60% – 30%)
- =55.61%
Therefore, the implied Vol shall be 55.61%.
Example 2
Stock XYZ is currently trading at $119. Mr. A bought a call option for $3 with a 12-day expiration date. The option has a strike price of $117, and the risk-free rate is 0.50 percent. Mr. A, a trader, wants to calculate the implied volatility using the details you’ve given.
The solution
To measure estimated IV, we can use the Black and Scholes formula shown below.
Calculate implied volatility using the data given below.
- 3.00 is the value of the call option.
- Price of stock: $119.00
- 117.00 is the strike price.
- 0.50 percent risk-free rate
- Expires at 12:01 a.m.
- Ke -rt = SN (d1) – N (d2)
- 3.00 = 119 times N(d1) – N(d2) times 117 times e-0.25 percent *12/365
Using an iterative and trial-and-error process, we can calculate Implied Volatility at 0.21, where the value is 2.97, and at 0.22, where the value is 3.05, indicating that the vol is between 21% and 22%.
Method of Trial and Error – Call Price of 21%
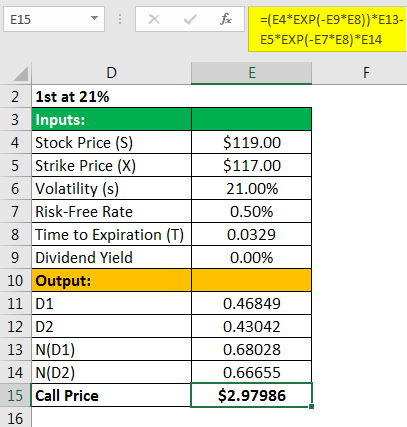
- =$119.00*e(-0.00%*0.0329))*0.68028-$117*e(-0.50%*0.0329)*0.66655
- =$2.97986
Trial and Error Method – Call price at 22%
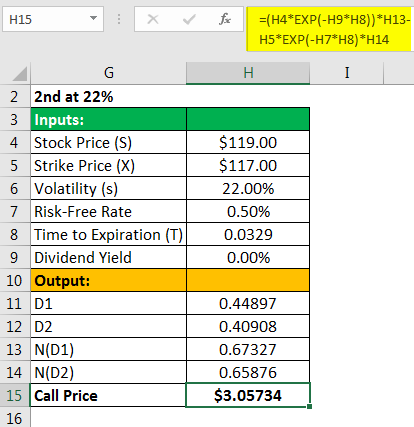
- =$119.00*e(-0.00%*0.0329))*0.67327-$117*e(-0.50%*0.0329)*0.65876
- =$3.05734
Now we can use the interpolation method to calculate the implied volatility at which it shall exist:
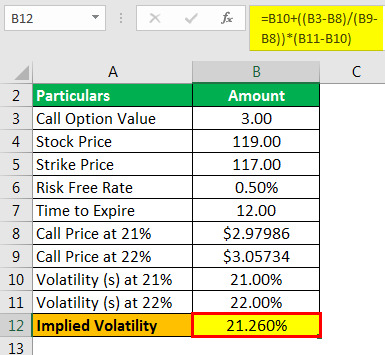
- = 21% + (3. – 2.97986) /(3.05734 – 2.97986)x (22% – 21%)
- =21.260%
As a result, the implied Vol would be 21.26 percent.
Implied Volatility Calculator
The Implied Volatility Calculator computes implied volatility for each option in a chain of options (option series). Calculating implied volatility (IV) for all options in a given sequence (or chain) at the same time is much more useful than simply calculating IVs for individual options (eg for an option you are considering trading). This is because the true essence of IV – including any volatility skew, term structure, or market mispricing – is only revealed by comparing the IVs of several options with a variety of strikes and expiry dates side by side.
This method is greatly simplified by the Implied Volatility Calculator. Calls and puts are grouped by a strike for each expiry month such that fluctuations in IV by call/put, strike (the volatility smile or volatility skew), expiry month (term structure), or current market trading anomalies may be easily identified.
Conclusion
- It is a measurement of the change in the price of security shortly.
- In a bearish market, it is high since investors assume that the price of the security will fall, whereas, in a bullish market, it is low since investors assume the price will go up in the future.
- It plays a major role in deciding the pricing of options.
- While calculating Implied Volatility, the determining factors are demand & supply, and time value.
- Black – Scholes – Merton model formula can be used to calculate the implied volatility by using reverse calculations if all other values are available.
- Its measurement is on the basis of the consensus of the market along with certain parameters and can turn out to be an incorrect prediction of the price movement.
Being forward-looking IV shall aid one to gauge the sentiment about the volatility of the market or a stock. However, it has to be noted that the implied volatility will not forecast in which direction an option is leaning towards. This IV can be used to compare with historical volatility, and hence decisions can be made based on those cases. This could be the measure of risk that the trader is putting into.
Implied volatility FAQs
How is volatility calculated?
Volatility is often calculated using variance and standard deviation. The standard deviation is the square root of the variance. For simplicity, let’s assume we have monthly stock closing prices of $1 through $10.
How do you find volatility of a stock?
Standard deviation is the most common way to measure market volatility, and traders can use Bollinger Bands to analyze standard deviation. Maximum drawdown is another way to measure stock price volatility, and it is used by speculators, asset allocators, and growth investors to limit their losses.
What are volatility indicators?
A volatility indicator is a technical tool that measures how far security stretches away from its mean price, higher and lower. It computes the dispersion of returns over time in a visual format that technicians use to gauge whether this mathematical input is increasing or decreasing
How do you calculate low volatility?
How to Find Options Opportunities With Low Volatility
- Locate stocks with unusually low implied volatility (IV) relative to their own IV history. …
- Using a daily price chart, determine if we have a good reason to be strongly bullish or strongly bearish on each stock.
- IV Crush: Implied Volatility Crush Overview (+ tips on how to avoid them)
- SHORT CALL: Best easy guide to master short call strategy
- Short Call vs Long Call Explained! Comparing risks and rewards
- Sell Put Options Overview with Options Trading Examples
- SHORT PUT OPTION: Overview, Examples (+trading tips)
- BUYING A PUT OPTION: All you should know with examples
- COVERED CALL OPTION: How To Use Covered Call Option Strategy Effectively (+ Detailed Guide)