
Do you know how your company is doing this year in comparison to last? No? To find out, compute YoY (year-over-year) growth. Your company’s year-over-year growth could help you determine what areas to improve.
Knowing the financial health of your company puts you in a better position to make decisions. Continue reading to find out what YoY(year-over-year) growth is, why it counts, the formula and how to calculate it (complete with easy-to-follow examples).
What Is the Meaning of YOY Year-over-year?
YoY Year-Over-Year is a method of examining numerous annualized sets of a company’s financial data from different years to determine how the data has evolved.
The data observed in a year-over-year format can be taken from separate months, quarters, or even full years, but each data set must be from the same length of time in order to provide accurate context–for example, one might look at how a company has performed in quarter one over the past four years, but comparing a company’s performance in Q1 2019 to that in January would be unhelpful.
This approach is also often used by economic analysts when examining countries and their overall economic position. For example, the YoY method reveals that Japanese GDP increased by 2% in 2016 compared to 2015, although economists had previously predicted a 1.8 percent gain.
Year-over-year performance measures your company’s performance in every area that can be measured. You may find your YOY growth for business performance measures such as:
- Revenue
- Cost of each acquisition
- Total number of employees
- Traffic to a website
Related: Key Performance Indicators KPIs: 145+Examples of KPIs
Understanding YoY (Year-Over-Year) Metrics
Year-over-year (also known as year-on-year) comparisons are a popular and effective technique to assess a company’s and investments’ financial performance. A YOY comparison can be made for any quantifiable event that occurs on an annual basis. Annual, quarterly, and monthly performance are all common YOY comparisons.
Reasons for YoY (Year-over-Year) Growth Metrics
When examining a company’s performance, YOY comparisons are important because they help eliminate seasonality, a characteristic that can affect most firms. Because most lines of business have a peak season and a low demand season, sales, profitability, and other financial measures shift throughout the year.
Retailers, for example, have peak demand during the holiday shopping season, which occurs in the fourth quarter of the year. It makes sense to compare revenue and profits year over year to fully assess a company’s performance.
It’s critical to compare one year’s fourth-quarter performance to previous years’ fourth-quarter performance. If an investor compares a retailer’s fourth-quarter earnings to the previous third-quarter data, it may appear that the company is experiencing extraordinary growth when, in fact, the difference is due to seasonality.
Similarly, when comparing the fourth quarter to the next first quarter, there may appear to be a substantial decrease, but this could also be due to seasonality.
YoY is also distinct from the word “sequential,” which compares one quarter or month to the last and allows investors to see linear growth. For example, the number of cell phones sold by a technology business in the fourth quarter vs the third quarter, or the number of tickets filled by an airline in January versus December.
What Does YOY Year Over Year Mean for Investors?
Investors sometimes place a high value on a company’s YoY growth when determining whether to invest in that firm because it is one of the clearest measurements of a company’s performance over time.
Investors often like YoY data since it adjusts for the effects of seasonality by comparing the same period of time over successive years, providing a clearer picture of the company’s direction.
Change in YoY Percentage
The year-over-year percentage change is the metric used to calculate YoY (year-over-year) growth. It demonstrates how much better or worse a company is doing in a specific statistic when compared to the same period of time in the previous year.
For example, rather than using raw numbers to describe how much a company’s net profit climbed between Q1 2019 and Q1 2020, a year-over-year percentage change is expressed as profit increasing by 18%.
Year-over-year YOY Growth
Year-over-year growth, or YoY growth, is the most typical application of Year Over Year data. It compares a company’s annualized data between two identical time periods from back-to-back years, focusing on how that data has changed.
The YOY growth rate is expressed as a percentage change. How much growth have you made this year compared to the previous year? Did you see an improvement or a reduction in the performance area you’re looking at?
Why is Year-over-year YoY growth important?
There are several reasons to consider YOY growth. Year-over-year calculations can be used to:
- Show you what works and what doesn’t.
- Assist you in obtaining investments
- Put seasonality in its proper context.
- Assist you in detecting problems
#1. Show you what works and what doesn’t.
Your year-over-year YoY calculations can assist you in measuring the performance of your company. You can tell if your company is growing year after year, not simply month after month. Long-term trends and if your firm is improving over time are plainly visible.
You can see what works and what doesn’t by measuring several business performance areas. If something isn’t working, you might need to minimize costs or make other changes to make it work better.
For example, your cost per acquisition may be lower for Product A but not for Product B year over year.
#2. Assist you in obtaining investments
Before providing you with business cash, most investors will want to check your year-over-year stats. Your year-over-year YoY growth tells them whether or not your company is a viable investment for them.
Whether the investor is a family member, a friend, a private investor in your small business, or someone else, make sure your year-over-year comparison is available.
#3. Place seasonality in the proper perspective
YOY calculations are very useful for businesses that experience seasonal peaks. A greenhouse’s sales, for example, may peak in the spring and summer, but a retail business’s revenues may peak in November and December.
Any monthly volatility is smoothed down by the YoY growth rate. You can compare your current business numbers to the same time last year to avoid seeing significant rises and falls between seasonal months.
You could discover:
- You’re doing better than last month, but you’re still down from last year.
- You’re doing worse than last month but better than last year.
#4. Assist you in detecting faults
A year-over-year study, like using a comparative income statement, may assist you to uncover errors and discrepancies in your records.
If there are significant increases or decreases from the previous year, you may have entered something erroneously. Examining different time periods year after year can assist you in determining when you may have made the error.
How to Calculate Year-on-Year YoY Growth
There are a few procedures you must take to calculate your company’s YoY year-over-year growth.
#1. Determine why you’re seeing YoY growth.
First and foremost, you must identify which areas of your business you wish to see YoY growth in. Is it money? How many staff are there? What are marketing KPIs? When it comes to year-over-year growth, the globe is your oyster…
So long as you have the numbers for your calculations. Once you’ve determined why you’re calculating YOY growth, collect the data for both time periods you’re comparing. That brings us to…
#2. Select a time frame.
Do you wish to calculate YOY growth between two distinct months, quarters, or even years? You have an option. However, by selecting shorter time periods, such as months, you can help to reduce seasonality difficulties.
#3. Apply the formula for year-over-year growth.
It is not difficult to calculate YoY year-over-year growth. Following the extraction of your data, you can quickly obtain results.
To begin, subtract last year’s number from this year’s number. This will tell you the year’s total difference. If the figure is positive, you have made a profit. If the result is negative, you have suffered a loss.
Then, divide the difference by the number from the previous year. This calculates the YoY year-over-year growth rate.
Finally, multiply the value by 100 to convert it to a percentage to obtain the year-over-year percentage change.
The YOY growth formula is as follows:
Year-over-year YoY Growth = [(This Year – Last Year) / Last Year] X 100.
Yoy Growth Formula
YoY (Year-over-year) Examples
Are you ready to jump right in? Examine the following examples to learn how you might calculate YOY (year-over-year) growth for the following business performance indicators:
- Revenue
- Customers who are unique
- Traffic to a website
#1. Revenue
Assume you want to compare your revenue in July of this year to July of last year. You earned $40,000 this July and $25,000 the previous July.
Subtract the revenue from last July from the revenue from this July.
$40,000 – $25,000 = $15,000
Divide the difference by the revenue in July of last year to find the growth rate.
0.6 = $15,000 / $25,000
Turn the growth rate into a percentage.
60% = 0.6 x 100
You increased your revenue by 60% year-over-year.
#2. Customers who are unique
Let’s look at another case. Assume you wish to compare unique consumers from this year’s Quarter 1 to the previous year’s Quarter 1. You had 5,000 unique clients in the first quarter. You had 7,500 unique clients in the first quarter.
Subtract the customers from the previous quarter from the customers in the current quarter.
-2,500 = 5,000 – 7,500
To get the growth rate, divide the difference by the revenue from the previous quarter.
-0.33 = -2.500 / 7,500
Calculate the YoY growth rate as a percentage.
-0.33 * 100 = -33%
You had a 33% decline in customers year over year.
#3. Traffic to a website
Assume you had 100,000 website visitors in January, a significant fall from the 200,000 you had in December. Before you panic, realize that your peak season is December, which may have contributed to the unexpected decline. Instead, you opt to calculate your YoY year-over-year growth to compare your website traffic in January to the same month last year.
You had 100,000 website visitors in January. You had 83,000 in January of last year. To calculate your growth throughout this time period, use the YoY formula.
[(100,000 – 83,000) / 83,000] X 100 = 20.48
Your website traffic increased by 20.48 percent year-over-year.
More YOY Examples
The majority of government statistics are published on a monthly or quarterly basis. To get the whole picture, you’ll need to calculate the YoY year-over-year growth data yourself. Here are three leading economic indicators where year-over-year comparisons are critical:
- Durable Goods: The Commerce Department publishes this information on a monthly basis. However, year-over-year calculations predicted the Great Recession as early as October 2006.
- Manufacturing Jobs: For years, America has been shedding manufacturing jobs on a monthly basis. However, as job growth began to decline year over year in 2007, it signaled the impending recession.
- Gross Domestic Product (GDP): This measures how quickly the economy increased in the most recent quarter. The GDP growth rate is annualized by the Bureau of Economic Analysis. It shows how much the economy would create if it kept growing at the same rate for the full year. The BEA does this to make it easier for you to compare YOY GDP growth to previous years.
Detailed Real-World Example of YOY Application
Kellogg Company posted mixed results for the fourth quarter of 2018, according to a 2019 NASDAQ report, revealing that its year-over-year earnings continue to drop, even as sales have climbed due to corporate acquisitions. Kellogg expects adjusted earnings to fall by 5% to 7% in 2019 as it continues to invest in alternative channels and pack formats.
The business has also revealed intentions to reorganize its North America and Asia-Pacific segments, cutting numerous divisions from the former and reorganizing the latter into Kellogg Asia, Middle East, and Africa. Despite lower year-over-year earnings, Kellogg’s stable presence and reaction to consumer consumption trends indicate that the company’s overall future is positive.
The Advantages and Disadvantages of YoY
Advantages of YoY
- Because it compares distinct moments in time, it negates seasonality.
- Smoothes out volatility throughout the year so that net outcomes can be compared.
- It is simple to calculate; no spreadsheet or financial calculator is required.
- States results presented in percentage form for easier comparison between enterprises of varying sizes.
Disadvantages of YoY
- If one time period has negative growth, the results are worthless.
- When comparing full-year data YOY, it is possible to conceal difficulties in a specific month.
- Unless combined with other measurements, it doesn’t provide much information.
Seasonality and Year-over-year YoY Growth
The YoY technique can also be used to analyze monthly revenue growth, which is especially relevant when revenue sources are cyclical. This enables for an apples-to-apples comparison of revenue rather than comparing revenue month-to-month, which might be affected by substantial seasonal swings.
In the relatively seasonal chocolate market, for example, comparing revenue growth between December 2016 and December 2017 (when sales are strong owing to winter sales) would be more informative than comparing March 2016 to February 2016, when holiday sales had begun to drop. When comparing months year over year, the comparison becomes more important than comparing two consecutive months that are affected by seasonality or other reasons.
Financial measures that are commonly used Year-over-year YoY
Here is a list of the most often used financial measurements for comparing one year to the next:
- Revenue from sales: How much have sales increased or dropped year over year?
- COGs (Cost of Goods Sold): How successfully has the corporation managed its gross margin?
- Selling General and Administrative Expense (SG&A): How well have leaders controlled company office expenses?
- EBITDA (Earnings Before Interest, Taxes, Depreciation, and Amortization): A measure of operating profit and a proxy for cash flow.
- Net Income: A comparison of the business’s bottom line over time.
- Earnings Per Share (EPS): Is a per-share look at the bottom line
Common Year-over-year Economic Indicators
Here is a list of the most often used metrics for comparing one year to the next:
- Inflation: What is the inflationary trend?
- Unemployment rates: What is the trend in labor-force participation?
- GDP: The amount of gross domestic product produced by a country.
- Interest rates: Are we experiencing rising or declining interest rates?
Related: Financial Ratio Analysis: Detailed Guide to Interpretation of Financial Analysis
Alternatives to Year-on-Year YoY Analysis
An analyst may want to look at other time-series data in addition to YoY analysis, such as:
- Month-over-Month
- Quarter-over-Quarter
- Year-to-date
- Compound Growth Rates
What Is the Difference Between YoY and YTD?
YOY considers a 12-month change. Year-to-date, or YTD, considers a change since the beginning of the year (usually January 1st).
If you simply consider a one-year timeframe, calculating how far a number has fallen from one year to the next is rather simple. Subtract the current year’s number from the previous year’s number, then divide the result by the previous year’s number and multiply by 100. If it’s negative, this is the percentage that metric fell for the year. A positive number represents an increase.
But what if you just have data from two years ago? Or how about simply six months? Or ten years? Is it possible to calculate the annual % change of this data so that it can be compared to other annual statistics?
Yes, there is. Here’s how to do it.
Analyzing the Formula
Let’s go through the principle first before diving into an example. The first step is to divide the starting value by the finishing value. This is done regardless of how far apart the numbers are in time.
After that, divide the number of years between the two numbers by one. So, if the dates are two years apart, one divided by two equals 0.5. If the numbers are six months apart (0.5 years), one divided by 0.5 years equals two. Keep that number handy for the next step.
Take out your trusty calculator at this point. In this step, we’ll compute an exponent by using the difference between the two integers from step one as the base and raising it to the power of the time difference divided by one.
To finish, subtract one from this exponent and multiply by 100 to get the annual percentage change between the two figures throughout that time period. Here’s the formula in its entirety:
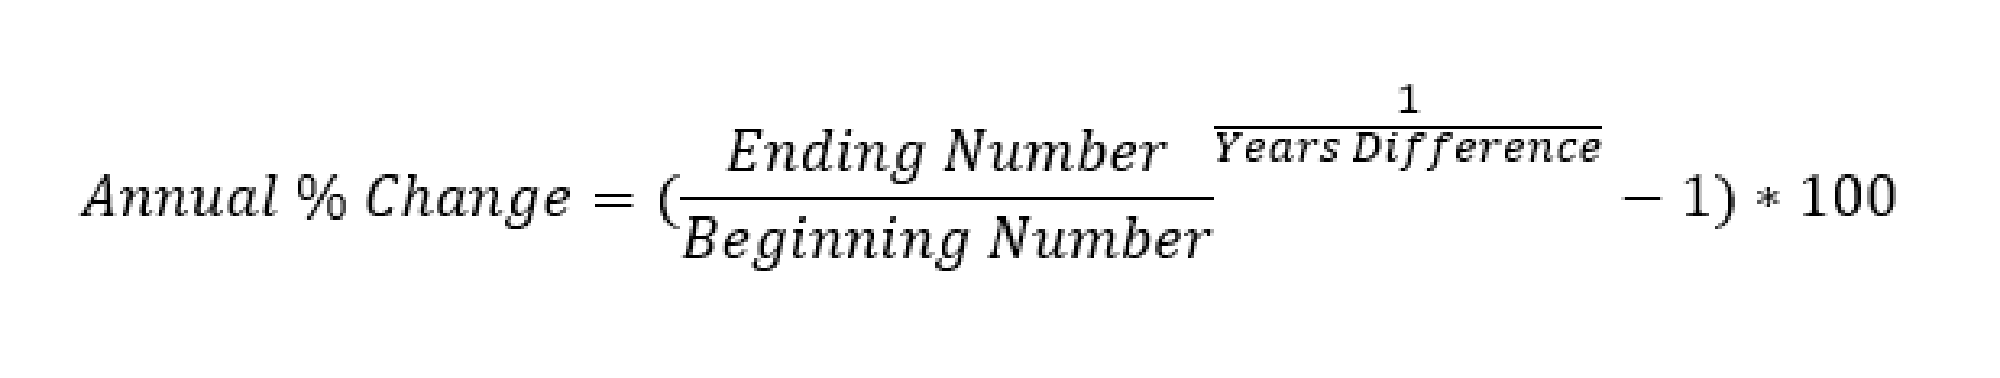
This technique applies to any measure you’re looking at, whether it’s a stock price, a sales number, profit, or the total assets on a balance sheet.
Related: MARKET RISKS: Best Practices and Easy Guide with Examples
QOQ, MOM and YOY Comparisons
MOM (Month-over-Month):
MoM (Month-over-Month) increases in levels are expressed in comparison to the prior month. The MoM calculations are more volatile since they are more influenced by one-time events (e.g. stock market crash, natural disasters, months with many working days, months with many people on vacation, etc.).
To calculate the MoM change, we compare the averages of Month X and Month Y. (e.g., an average of June with July and a report in August, like the Consumer Price Index or CPI)
((Month X – Month Y numbers)/Month X) * 100= Percentage Growth
QOQ (Quarter-over-Quarter):
QoQ (Quarter-over-Quarter) numbers calculate change from the prior fiscal quarter, such as comparing Q2 to Q1 of this year. Although many numbers are given weekly, several crucial indicators, such as GDP, are released quarterly (gross domestic product). QoQ figures are more variable than year-over-year figures but less volatile than month-over-month figures.
To compute the QoQ change, we compare the average of Financial Quarter X with Financial Quarter Y. (e.g., an average of Quarter 1 2009 with the average of Quarter 2 2009)
((Quarter X – Quarter Y numbers)/Quarter X number)x 100 = Percentage Growth
YoY (Year-over-Year):
YoY (Year-over-Year) numbers show how a year’s worth of data has changed in comparison to the prior year. It combines additional data and, as a result, provides a more accurate long-term view of the underlying report figure.
To determine the YoY change, we compare the average of Years X and Y. (e.g., an average of June 2008 with the average of June 09)
((Year X – Year Y numbers)/ Year X number) x 100= Percentage Growth
The following is how the compound annual growth rate (CAGR) is calculated:
CAGR=((4th Year/1st year)^(1/3))-1
Make sure you understand which era is being compared in any trend report you are looking at (year, quarter, month, week, day). As a result, a blog’s performance can drop 0.2 percent in July (Month-over-Month) while yet increasing 4.1 percent in the 12-month period ending in July (Year-over-Year).
MoM data, such as the CPI (Consumer Price Inflation), are provided with a two-week lag, so people may not know how this month’s inflation impacts their wallet until the middle of the following month. Finally, journalists, investors, budget analysts, and top management are interested in the most recent monthly and 12-month rates.
Summary
Year-over-year growth is a metric used to measure growth over the preceding 12 months. When comparing organizations or economies, YOY is an excellent measure to use to control for the effects of volatility.
While this is a useful statistic, it falls short of capturing the entire picture because it omits key information. This statistic can be used to identify trends that indicate an impending economic downturn.
YOY FAQ’s
What is YoY and MoM?
MoM (Month-over-Month) increases in levels are expressed in relation to the prior month. YoY (Year-over-Year) numbers show how a year’s worth of data has changed in comparison to the prior year.
How do you calculate average yoy growth?
You will need to know the values for each year as well as the number of years you are comparing for the average growth rate overtime formula. The average growth rate over time method is calculated by dividing the present value by the historical value, multiplying the 1/N power, and then subtracting one.
What is a good yoy growth rate?
Industry Standards
Growth rate standards vary by company stage, but on average, organizations expand between 15% to 45 percent year over year.
What does MTD, QTD and YTD stand for?
YTD stands for Year-to-Date (from January 1 of this year to current date) QTD stands for Quarter-to-Date (From the beginning date of the current quarter to current date) MTD stands for Month-to-Date (From the beginning date of the current month to the current date)
How do you calculate yoy decline?
Subtract the current year’s number from the previous year’s number, then divide the result by the previous year’s number and multiply by 100. If it’s negative, this is the percentage that metric fell for the year. A positive number represents an increase.
- Financial Performance: A Comprehensive Guide For Any Business(+ quick tools)
- Return on Equity: Meaning, Formula & How to Calculate (+Quick tools)
- High Dividend Mutual Funds: Best 2023 Options (Updated)
- Debt To Equity Ratio: Explained!!!, Formula, Calculations, Examples
- Average Collection Period (ACP): Formula, Calculations & Importance