Yield curve is for investors in bond. The simplified meaning of yield curve is a curve plotted on a graph that shows the yields of different bonds that have different maturities, typically from three months to 30 years.
Do we know what a bond is?
A bond is a financial instrument that has a fixed income, typically representing a loan you gave to a corporate organization or the government. They use these bonds to finance projects. At the end of the term (period) of the bond, the bond issuer (government or corporate organization) will have to pay back their investors.
It is likened to you as a businessman going to get a loan from the bank. But in this case, the loan is between an individual and the government.
A bond has fixed interest rates as well. Some have variable interest rates. This is because there are different types of bonds.
Moving on, we will discuss yield curve meaning, analysis, and inversion.
Yield Curve Meaning
The yield curve meaning is a way to measure how the bond investor feels about risk and return.
YC shows graphically the interest rates between long and short-term bond yields.
In the plotting of the graph, the bond yield is on the vertical axis and the years to maturity on the horizontal axis.
It shows the cost of long and short term investments and allows companies to decide their capital structures and when to change an already existing one.
Capital structure is the financing mix organizations operate with. They can decide to use just equity capital as its financing tool or just debt. They may also use a mix of equity and debt.
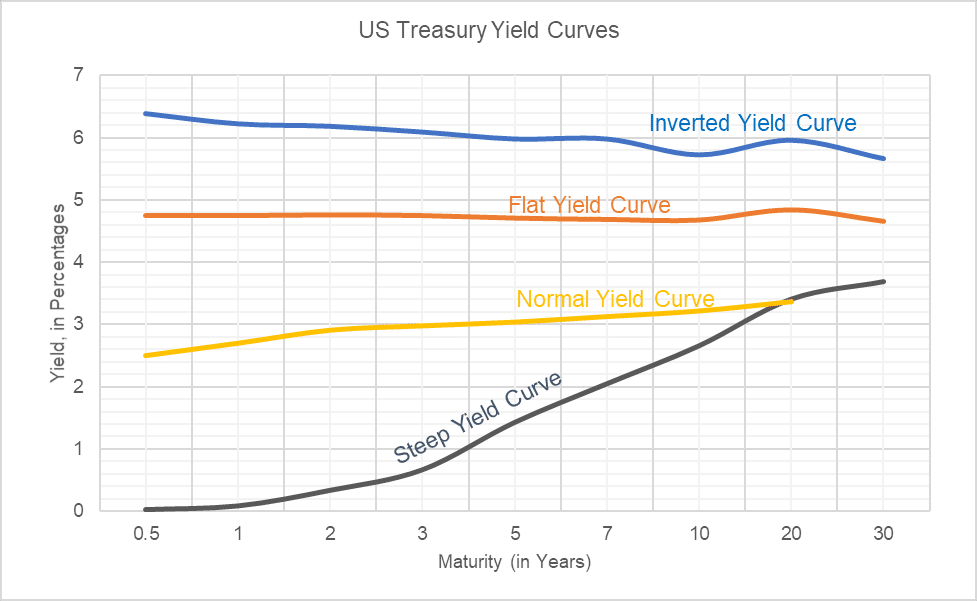
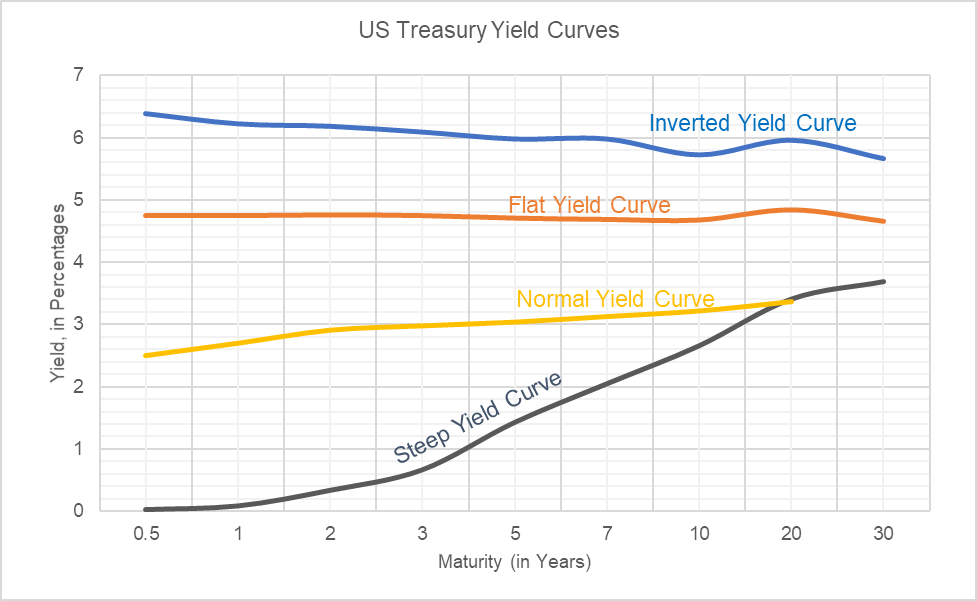
For example, let us consider the following data obtained from US Department of Treasury website regarding yield on US treasuries.
| Date ↓/ Maturity→ | Shape of Yield Curve | 0.5 | 1 | 2 | 3 | 5 | 7 | 10 | 20 | 30 |
|---|---|---|---|---|---|---|---|---|---|---|
| 31-Aug-00 | Inverted | 6.38 | 6.22 | 6.18 | 6.09 | 5.98 | 5.98 | 5.73 | 5.96 | 5.67 |
| 03-Mar-06 | Flat | 4.75 | 4.75 | 4.76 | 4.75 | 4.71 | 4.69 | 4.68 | 4.84 | 4.66 |
| 26-Sep-13 | Steep | 0.03 | 0.09 | 0.34 | 0.67 | 1.43 | 2.05 | 2.66 | 3.41 | 3.69 |
| 11-Feb-18 | Normal | 2.5 | 2.7 | 2.91 | 2.98 | 3.04 | 3.13 | 3.22 | 3.37 | 3.46 |
If we plot these on a graph, we get the following diagram. This is called the yield curve.
Types of Yield Curves (YC)
There are four basic classifications and these depend on their shape.
#1. Normal yield curve
A normal yield curve involves the short-term bonds usually carry lower yields to show that the investor’s fund is at less risk. While the long-term yields have higher return because it involves a long-term investment and invariably, risk.
The philosophy of bonds is that the longer the bond, the more you will be rewarded as there is a risk that the bond issuer will not pay you back.
This is shown in the normal yield curve that slopes from right to left. Here, the investors expect the economy to grow at a normal pace.
#2. Steep YC
This is type is where the short-term yield is at the normal yield curve level but the long-term yield is higher.
This yield shows that the interest rates will increase in the future. In fact, interest rates are expected to increase.
#3. Flat YC
Here, there is no significant difference between the returns of the long-term and short-term bonds.
When this happens, no one will want to go for long-term investments because they expect the interest rate to fall. And they might end up losing their initial investment.
#4. Inverted YC
Otherwise called abnormal yield curve, it is the opposite of the normal yield curve. The inverted yield curve for short bonds is higher than the yield for longer bonds. The curve slopes downwards and the graph is inverted.
#5. Humped YC
This is another YC that occurs when the medium-term yield is greater than both short and long term yields. This curve indicates that economic growth is slow, it is very rare.
Importance of Yield Curve
From the yield curve meaning we can see that it is used as a benchmark for debts in the financial market, such as mortgage rates or bank lending rates. In addition, it is used to predict changes in economic output and growth. Yield curve has the following importance.
#1. Financial Intermediary
Because financial institutions get most of their funds by selling short-term deposits and then lend on a long-term basis, the curve between lending and borrowing is steep when there is high profit.
When there is a decrease in profit, the curve is flat.
#2. Maturity and Yield
It shows the relationship between maturity and yield. If the curve is sloping upwards, the investor will have to invest in long term security to increase his yield. And we are aware that the longer the maturity, the higher the risk.
#3. Overpricing or Underpricing Securities
The curve shows securities (bonds) that are either overpriced or underpriced. To know an underpriced bond, the rate of return will be above the curve. For an overpriced bond, the RR will be below the curve.
#4. Forecast Interest Rate
The shape of the curve shows the investor what the interest rate will likely become.
A normal curve shows short term bonds will have a higher yield and an inverted curve that short term bonds have a higher yield.
See Also: Funding Opportunities-Graymatter capital
Factors that Influence Yield Curve
1. Economic growth
Strong economic growth leads to an increase in yields. The curve is typically steep. During periods of strong economic growth, there are many investment options available so organizations compete for capital.
2. Inflation
CBN usually responds to inflation with an increase in interest rate because inflation leads to a decline in purchasing power. Here, investors expect an increase in interest rates for their short term investments.
3. Interest Rates
This one is a bit tricky.
Because Central bank has raised interest rates, there will be an increase in demand for investments by investors. Eventually, this rise in investment will lead to a decrease in the interest rate.
Read Also: Inverted Yield Curve: All you need to know with detailed analysis (+examples)
Yield curve analysis involves the measurement of differences in interest rates between securities that have different terms to maturity. YC then examines these in a graphical representation.
Yield Curve Theories
#1. Pure Expectation Theory
According to this theory, the various maturities are substitutes, and the shape of the yield curve is determined by the market’s anticipation of future interest rates. This theory states that yields change over time, but it fails to specify the specifics of the YC shapes. This theory takes no account of interest rate risk or reinvestment risk.
#2. Liquidity Preference Theory
The Pure Expectation Theory is an extension of this theory. It includes a charge known as the liquidity premium or term premium. This theory takes into account the higher risk of holding long-term obligations over short-term debts.
#3. Market Segmentation Theory
The segmented market theory is based on the distinct demand and supply relationships that exist between short-term and long-term securities. It is based on the notion that securities of different maturities cannot be exchanged for one another.
Because investors prefer short-term maturity assets to long-term maturity securities because the former offers reduced risk, the price of short-term securities will be higher, and hence the yield will be lower.
#4. Habitat Preference Theory
This is a development of Market Segmentation Theory. Investors, according to this theory, choose a specific investing horizon. They will have to pay a premium to invest outside of this time frame. This theory explains why long-term yields are higher than short-term yields.
Is there any confusion? Get back to us in the comment box.
Yield Curve FAQ’s
What is meant by yield curve?
A yield curve is a line that depicts the yields (interest rates) of bonds with the same credit rating but different maturities. The slope of the YC predicts future interest rate movements and economic activity.
Why are yield curves important?
A yield curve is a method of measuring bond investors’ risk tolerance, and it can have a significant impact on the returns you receive on your investments. The YC can even be used to predict the direction of the economy if you understand how it works and how to read it.
What does a positive yield curve mean?
An upward sloping yield curve is defined by interest rates that are greater on long-term debt than on short-term debt.
What's the riskiest part of the yield curve?
In a normal distribution, the end of the yield curve is the riskiest because minor movements in short-term rates compound into bigger movements in long-term yields. Long-term bonds are extremely sensitive to changes in interest rates.
- Yield Curve Theories
- Inverted Yield Curve: All you need to know with detailed analysis (+examples)
- Balance Sheet vs. Income Statement: Examples, Differences & Relationship
- Yield: Definition, How to Calculate with Examples, & Types
- MARKET CLEARING PRICE: How To Find Market Clearing Price(+Detailed Guide)
- Dividend Yield: Meaning, Detailed Examples, Formula & Free Investor Tips