An inverted yield curve indicates that interest rates on US Treasurys have flipped, with short-term bonds paying more than long-term bonds. An inverted yield curve is used to predict disaster. That’s right! Do you want to use this tool to predict a recession? Find out how below.
We already have a post on the yield curve. Read it here.
What is an Inverted Yield Curve?
It represents a situation where long term debt instruments invested yield lower returns than even the short-term debt instruments of the same credit capacity.
We all know that long-term debt instruments have higher risk rates. This makes their yield higher. However, where a situation occurs that makes its return lower than the short-term bonds, we say the graph has an inverted yield curve.
Although investors require higher yield for a higher risk investment, under abnormal circumstances when they believe that the economy will run into a recession they will accept a lower yield.
In addition, an inverted yield curve shows that the market believes that inflation will remain low. For instance, during inflation, we know that prices of goods and services increase. People will tend not to invest in long term instruments as they are in need of liquidity. The yield for it will increase but because of factors like quality, currency, the yield will reduce.
Although this rarely happens, when it does, it indicates that there or an impending economic recession.
Understanding Inverted Yield Curve
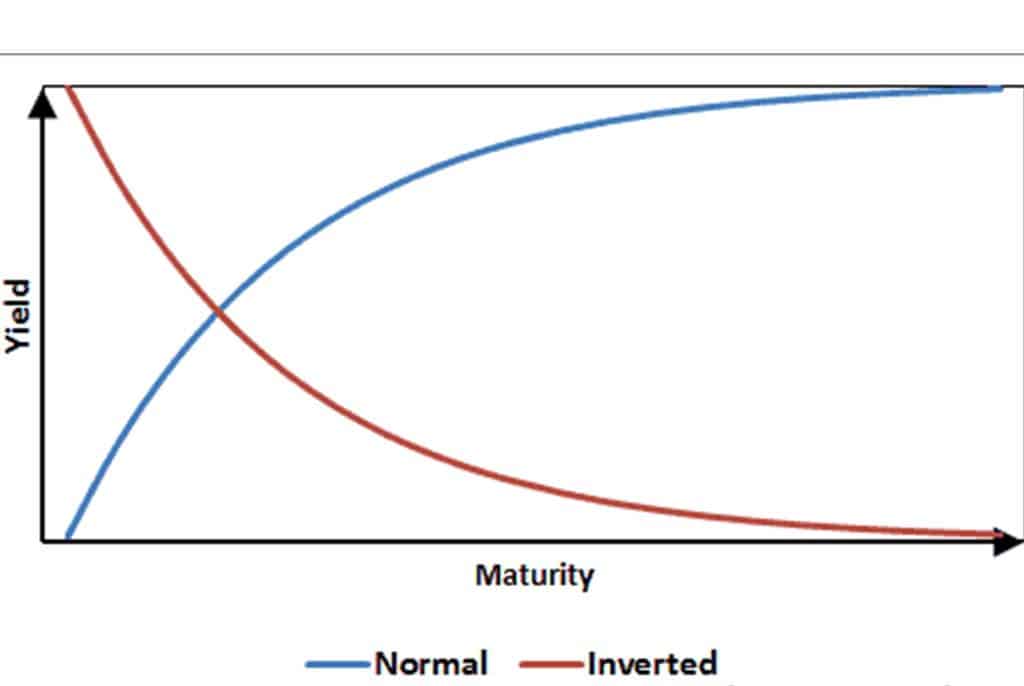
In a normal yield curve, the short-term yield is usually lower than the long-term yield. That is to say, you get a smaller amount for giving out your money for a short period and a higher return for a long time.
When this normal flow ceases, it means that investors do not have confidence in the economy to leave their funds for longer periods. They believe that the economy is getting worse in the near future than in the far future.
Why does the Yield Curve Invert?
When many investors start investing in long term bonds, the yields on them fall. This is typical in every market. In this period, they are in demand so they do not need a high yield to attract investors.
However, the demand for short-term bonds are low, so they need to pay a higher yield to attract investors.
So, if investors perceive an impending recession, they go for investment with maturities of less than 2 years. This inverts the yield curve because, from the statistics, recession lasts for an average of 11 months.
Currently, the yield curve inverted in February 2020. The yield on the 10-year note fell to 1.59% while the yield on the one-month and two-month bills rose to 1.60% due to the pandemic.
The curve is gradually worsening. By March 9, the 10-year note had fallen to a record low of 0.54%.
The Development of an Inverted Yield Curve on Bonds
As investors become more concerned about an impending recession, they tend to buy long Treasury bonds on the idea that they provide a safe haven from declining equity markets, capital preservation, and the possibility for value gain as interest rates decrease. As a result of the shift to longer maturities, yields may fall below short-term rates, resulting in an inverted yield curve. Since 1956, equities have peaked six times after an inversion begins, and the economy has gone into recession within seven to 24 months.
The most recent inverted yield curve, as of 2017, initially appeared in August 2006, when the Fed boosted short-term interest rates in reaction to overheating equities, real estate, and mortgage markets. The yield curve inversion occurred 14 months before the high of the S&P 500 in October 2007 and 16 months before the official start of the recession in December 2007. However, an increasing number of financial organizations’ 2018 economic forecasts predict that an inverted yield curve is on the horizon, noting the shrinking difference between short- and long-dated Treasuries.
If history is any guide, the current business cycle will continue, and the economy may eventually slow. If investors’ anxieties about the next recession escalate to the point where they consider long-term Treasuries as the best option for their portfolios, the next inverted yield curve is very likely.
The Effect of an Inverted Yield Curve on Consumers
An inverted yield curve has an effect on consumers in addition to investors. For example, homebuyers who use adjustable-rate mortgages (ARMs) have interest-rate schedules that are changed on a regular basis based on short-term interest rates. When short-term interest rates are greater than long-term interest rates, ARM payments tend to climb. Fixed-rate loans may be more appealing than adjustable-rate loans when this occurs.
Credit lines are affected in a similar way. In both circumstances, customers must devote a bigger amount of their income to debt servicing. This diminishes disposable income and has a negative impact on the whole economy.
The Effect of an Inverted Yield Curve on Fixed-Income Investors
An inversion of the yield curve has the greatest impact on fixed-income investors. Long-term investments typically provide greater returns; because investors risk their money for longer periods of time, they are rewarded with higher rewards. An inverted curve eliminates the risk premium for long-term investments, allowing investors to earn higher returns on shorter-term investments.
When the spread between US Treasuries (a risk-free investment) and higher-risk corporate alternatives is at a record low, it is frequently a simple option to invest in lower-risk vehicles. In such instances, purchasing a Treasury-backed asset gives a yield comparable to trash bonds, corporate bonds, real estate investment trusts (REITs), and other debt instruments, but without the risk associated with these securities. Money market funds and certificates of deposit (CDs) may also be appealing, especially when a one-year CD offers yields comparable to a 10-year Treasury bond.
The Effect of an Inverted Yield Curve on Equity Investors
Profit margins for organizations that borrow cash at short-term rates and lend at long-term rates, such as community banks, decline when the yield curve inverts. Similarly, hedge funds are frequently required to take on additional risk in order to reach their desired level of returns.
In reality, Long-Term Capital Management, a well-known hedge fund founded by bond trader John Meriwether, is mainly blamed for its demise due to a disastrous bet on Russian interest rates.
Regardless of the ramifications for some parties, yield-curve inversions have a lower impact for consumer staples and healthcare companies, which are not interest-rate dependent. When an inverted yield curve precedes a recession, this relationship becomes evident. When this happens, investors tend to gravitate toward defensive stocks, such as those in the food, oil, and tobacco industries, which are often less affected by economic downturns.
The yield curve momentarily reversed in 2019. Inflationary pressures from a tight labor market, along with a series of interest rate hikes by the Federal Reserve from 2017 to 2019, have exacerbated fears of a recession. These expectations finally prompted the Fed to reverse its interest rate hikes. This yield curve inversion predicted the start of a recession in 2020.
Throughout much of 2006, the yield curve was inverted and long-term treasury bonds outperformed stocks in 2007. Long-term Treasuries skyrocketed in 2008, when the stock market plummeted. In this situation, the Great Recession struck and proved to be far worse than anticipated.
The yield curve momentarily inverted in 1998 and treasury bonds prices rose for a few weeks following Russia’s financial default. The Federal Reserve’s quick interest rate decreases aided in preventing a recession in the United States. The Fed’s actions, on the other hand, may have led to the later dotcom bubble.
Example of a Case of an Inverted yield curve
A great example happened in 2005 in the US when the federal fund rate was increased to 4.25%. This caused the two-year Treasury bond yield to 4.4% while the seven-year bond gave 4.3%.
As time went on, the curve began to invert some more as the recession began approaching and investors continued to invest more heavily into longer-term bonds.
Eventually, the country experienced a recession.
In 2019, the yield curve also briefly inverted. There were signals of inflation, interest rates were also increased by the Federal Reserve. This inversion of the yield curve signalled the onset of recession during 2020.
What Are Some Theories About the Yield Curve’s Shape?
The yield curve’s structure is explained by two basic economic theories: the pure expectations theory and the liquidity preference theory. Forward long-term rates are assumed to be an average of projected short-term rates over the same total maturity term in pure expectations theory. According to liquidity preference theory, investors will seek a premium on the yield they receive in exchange for tying up liquidity in a longer-term bond. These theories explain the shape of the yield curve as a consequence of investors’ current preferences and future expectations, as well as why the yield curve slopes upward to the right in normal times.
In conclusion, to understand the inverted yield curve invert, you’ll first understand bonds.
Here’s a little recap
- Bonds are safe investment options. A typical bond is the one offered by banks for a return.
- It is always a safe option for people who do not feel confident in the market.
- If more people invest in bonds, their return rate goes down.
However, take an inverted yield curve as a sickness. More like an indication of a recession and a subsequent market crash.
Did this meet your requirement? Reply in the comment box.
Inverted Yield Curve FAQ’s
Why does the inverted yield curve signal a recession?
Inversion of the yield curve is a typical indicator of an impending recession. In the last 50 years, the US curve has inverted before every recession. When short-term rates rise above longer-term yields, it indicates that short-term borrowing costs are higher than longer-term loan costs.
What shape is an inverted yield curve?
Normal (upward sloping curve), inverted (downward sloping curve), and flat are the three main yield curve shapes.
How many times has an inverted yield curve predicted a recession?
In each of the last five decades, the inverted yield curve has dependably foretold a recession.
Is the yield curve inverted 2023?
The yield on 30-year Treasuries has recently fallen significantly below the yield on 20-year Treasuries. This is also consistent with the yield curve flattening since March 2023.