Most businesses focus on making money right now, but a good business plan also answers the question, “What about the future?” The BCG matrix, also known as the Boston matrix or the growth-share matrix, is a method for analyzing products that were created by the Boston Consulting Group. Since 1968, businesses have used the BCG model to figure out which products will help them grow their market share and get a competitive edge. The BCG matrix model and example, which have been around for over 50 years, are still effective for analyzing a business and improving it. How does the growth-share matrix work? How do you calculate market growth in the BCG matrix? What is the significance of BCG? What is the order of the four quadrants? These are some of the few questions we will be answering in this article. Enjoy!
What is the BCG Matrix?
A BCG matrix is a model that is used to look at a company’s products and help plan its long-term strategy. The matrix helps companies find new ways to grow and decide where to put their money for the future.
Furthermore, most businesses have a wide range of products, but some make more money than others. The BCG matrix gives the business a way to figure out how successful each product is. This helps the business decide which products to invest more money in and which ones to get rid of. It can also help companies come up with a new product to sell.
In other words, the BCG matrix is a way to figure out how a company’s present and future fit in with its surroundings. Companies could be placed in the “high” or “low” quadrants of the matrix depending on their relative market share and rates of industry growth. Having a larger relative market share than a competitor means that your SBU’s sales this year were higher than those of the competitor.
The analysis calls for both metrics to be calculated for each SBU. Relative market share is a metric used to evaluate how dominant a company is in its industry. This hypothesis is based on the idea that there is an experience curve and that market share is gained by having the lowest overall costs.
How Does the Growth Share Matrix Work?
The BCG matrix is based on the idea that consistently high returns come from being the market leader. In the end, the market leader will have a cost advantage that is both sustainable and difficult to replicate for new entrants. Then, the markets with the highest growth rates can be identified.
Before investing, businesses should think about how competitive their company is and how attractive their market is. The BCG matrix shows that market share and growth rate are the main drivers behind these two things.
There is a unique combination of relative market share and growth in each of the four quadrants.
- Low Growth, High Share: In order to reinvest, businesses should maximize the profits from these cash cows.
- High Growth, High Share: Increasing market share accompanied by rapid expansion. These “stars” have a lot of potentials, so companies should put a lot of resources into them.
- High Growth, Low Share: Firms should decide whether to put money into these “question marks” or write them off based on their potential as stars.
- Low Share, Low Growth: A company may choose to liquidate, dispose of, or reposition its “pets.”
The success of a product depends on being able to get a big share of the market before it stops growing. It’s inevitable that everything becomes a cash cow or a pet. Having a pet shows that you are not a good leader or that you can’t admit defeat and give up.
What Are the Four Quadrants in Order?
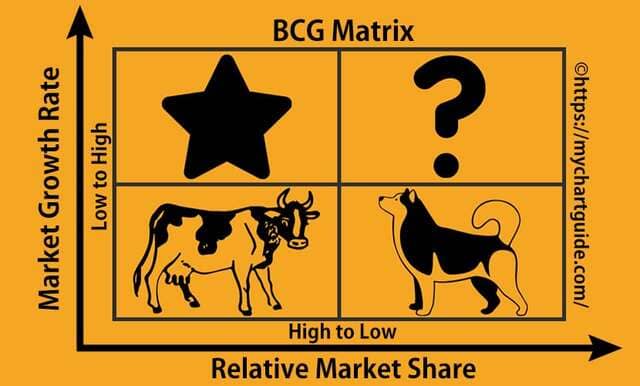
Both relative market share and market growth rate are used to place companies in one of the four quadrants of the BCG matrix. On both the horizontal and vertical axes of market share, this BCG matrix shows the rate of market growth. Here are the four cells of this BCG matrix with various symbols:
#1. Stars
The stars show rapid expansion and capture a disproportionate piece of the market. The upper left quadrant of the matrix is where you’ll find the stars. They are well-known products or brands in markets that are growing quickly, so a company should give them the most investment money. In addition, they make a big difference in the economy and have a big share of the market. Profits from stars are often higher than those from the other three sectors.
#2. Cash Cow
Cash cows are stable businesses that don’t grow rapidly but yet generate a lot of revenue. In the bottom left corner, you’ll find products and brands that have become market leaders in a market that is slowly growing.
They are top-selling products that have already proven themselves in the market and often require little in the way of new investment. Companies would be wise to keep these products in production as long as possible because of the money they bring in, which can be put to use in other areas. Cash cows are investments that always make a lot of money, no matter what happens with the economy or the stock market.
#3. Question Marks
Common in fast-growing sectors; “?” symbols need large capital infusions to keep or expand market share. They are typically new offerings that have solid commercial potential. They could really take off if given the resources to do so. In addition, they could turn into stray animals if cared for poorly.
#4. Dogs
Low growth and a small portion of the market share place dogs in the bottom right corner. High costs, poor quality, or ineffective promotion could all be to blame for the disappointing results. A corporation would be sensible to get rid of these money and resource pits if there is no chance of expanding market share. There is a high likelihood of losing money while attempting to monetize a dog.
What Does the BCG Matrix Evaluate?
With the BCG matrix, the company can figure out how well each product is doing. This helps the company figure out which products should get more money from the company and which ones should be stopped altogether. It can also help businesses figure out what new products they can put on the market.
BCG Matrix with Example
A BCG matrix example can help your business in many ways, including marketing, project management, and overall strategic planning. Strategic planning is where marketing plans and programs are born, and here is where the matrix is most often used. It’s also useful for analyzing the portfolios of companies.
Here is a few example of the BCG matrix to examine:
- It means putting more money into a product in order to get a bigger slice of the market: A product that falls into the “?” category indicates that a gain in market share can be expected from an investment in that product.
- How to tell if a product is worth waiting to invest in: You can pretty much count on stagnation if your product falls into the “dog” category. Products in this section are ideal if you need a temporary break from investing.
- To increase a product’s profitability: Use the BCG matrix to identify your best sellers so you can focus your marketing efforts on these “star” items. You may use the matrix to find out which products generate the most money by looking at which ones have the most market share.
- For optimum use of available means: The BCG matrix illustrates which goods are most likely to generate a return on investment, allowing you to prioritize your efforts. This is fantastically useful for companies competing in a dynamic market.
Generally speaking, the matrix works better for huge companies than for smaller ones. When dealing with smaller companies, it may not be possible to accurately calculate their relative market share. It also assumes that if a company spends more on marketing, it will get a bigger share of the market. If you don’t have much money, you might not be able to take full advantage of the BCG matrix.
How Do You Calculate Market Growth in the BCG Matrix?
It’s crucial for companies to think carefully about a number of variables before breaking into new markets or significantly growing in existing ones. Market size and the rate of growth are important. The statistics can estimate market revenue, but they can’t predict business success.
The market growth rate is the change in the size of a market over a certain amount of time, usually shown as a positive or negative percentage. It measures how much more people want a product or service in a market. Market growth is directly related to how much people want to buy. Here is a brief tip on how to calculate market growth in the BCG matrix:
- To calculate market growth, you require the market’s revenue size (including total sales for the entire market with you and all your competitors combined). This is your current market size. For every year you want to monitor development, you’ll need that value. To determine this, we need to differentiate between the first year’s market size and the second year’s market size. To convert to a percentage, multiply the final figure by 100 and then divide by the size of the market in the first year.
- We’ll take “Year One” and “Year Two” as easy examples:
(Year 2 Market Size – Year 1 Market Size)/(Year 1 Market Size) x 100 = Market growth rate (%)
It’s important to remember that a single year’s market growth calculation doesn’t tell the whole story of the market. We recommend that you do some simple math to figure out the average annual growth rate in your field over a number of years. Those numbers will help you make a trend that shows the state of the market.
What Is the Importance of the BCG Matrix?
The importance of the BCG matrix is:
- With only two dimensions and four quadrants, it’s easy to use and explain.
- It is a true strategy framework that has stood the test of time and numerous shifts in the industry landscape.
- In most cases, the necessary metrics, such as market expansion and relative market share, as well as competitive metrics, are readily available to the organization, making the process straightforward to carry out and plan for.
- Investing and supporting business units (or brands, or products) has a clear strategy, with the exception of the? An essential strategy for allocating capital for businesses aiming to increase their share of a given market while also reaping the benefits of an expanding track record, the experience curve
- Strategic resource allocation inside the company is possible thanks to the company’s ability to assess the relative strengths and potential of each of its business units in light of the competitive landscape. Also read, DECISION MATRIX: Meaning, Use, and Guide.
What Two Metrics Are Used in the BCG?
The two metrics are the relative market share and the market growth rate.
The Boston Consulting Group (BCG) came up with a common method for analyzing a company’s portfolio. Businesses put all of their products and services into a two-by-two matrix, with the market share on the left and the rate of market growth on the right.
What Are the Limitations of the BCG Matrix?
With the BCG matrix, it’s easy to compare many different business units and come up with a plan for how to divide up resources between them. It’s important to note that the BCG matrix does have some restrictions, specifically the ones listed below:
- There are only two variables in the BCG Matrix: market share and growth rate.
- There are other metrics by which success can be measured besides these.
- It fails to take into account the value of cross-brand promotion.
- Market share doesn’t necessarily equate to success.
- Since gaining a large part of the market is expensive, it is not certain to increase revenues.
- Sometimes canines can give a company or its products a leg up on the market.
- The model doesn’t take into account up-and-coming small businesses.
Conclusion
If you consider all of the above, you can determine the optimal path from startup to the market leader by using the BCG matrix. The best way to fund the question marks and stars is to capitalize on opportunities that generate cash cows. Furthermore, dogs should be sold or traded in order to free up low-value funds that could be put to better use elsewhere. Last but not least, you’ll need a fair distribution of question marks, stars, and cash cows to ensure future positive cash flows.
BCG Matrix FAQs
What are the benefits of using the BCG matrix?
- It’s simple to understand
- It helps you allocate resources
- It’s easy to create
Is the BCG Matrix Used in the Real World?
At its height of popularity, BCG claims that 50% of all Fortune 500 businesses employed the growth-share matrix; even now, it remains an integral part of business strategy curricula.
Similar Posts
- Top 10 Business Consultant Companies in 2022 (Updated)
- Best 47 Lead Generation Software In 2022
- Ansoff Matrix Explained: Practical Examples, Theory, & Strategy
- NFL LOGO: Meaning, Evolution, and History
- WHAT IS ATS: Examples & What You Should Know