For small businesses to succeed, they must have a well-defined plan and corresponding key performance indicators. They cannot expect to succeed without strategic projects, a clear vision and purpose, and an effective management structure.
A meaningful collection of Key Performance Indicators helps facilitate a successful business plan. However, small businesses may lack the time and resources to choose and implement KPIs. That is why, in this article, I will examine KPIs today and look at some practical examples and the best KPI software or tools for small businesses.
Revenue, profit, and customer satisfaction are the three things that are necessary to measure for any organization. There is no question that these KPIs will always come first. The important thing is to put a set of measures in place. So I will begin by providing a definition.
Key Points:
- Key performance indicators (KPIs) help measure the success of your small businesses against a set of targets, objectives, or industry peers.
- KPIs can be financial. Examples of such are revenues, expenses, and net profit, also known as net income.
- Client happiness, client retention, and per-customer efficiency are at the core of customer-focused KPIs.
- Measurement and monitoring of operational performance throughout the company is the goal of process-focused KPIs.
- Small businesses make use of analytical software and tools to measure and monitor their businesses.
What are Key Performance Indicators (KPIs) in business?
Key Performance Indicators (KPIs) are performance indicator measures that show how long it takes to reach a strategic goal. KPIs track the advancement of organizational performance goals as opposed to personal goals. The most common use for them is monitoring strategic goals and objectives. Additionally, they can also be used to gauge operational goals’ repeatable accomplishments.
Features of Key Performance Indicators
The primary features of KPIs are:
- They can be counted as a value measure and are quantitative.
- KPIs are not used to assess individual performance, but rather to monitor the advancement of strategic company objectives.
- KPIs use the Red, Amber, and Green (RAG) system, among other threshold measurements of acceptability, to compare performance.
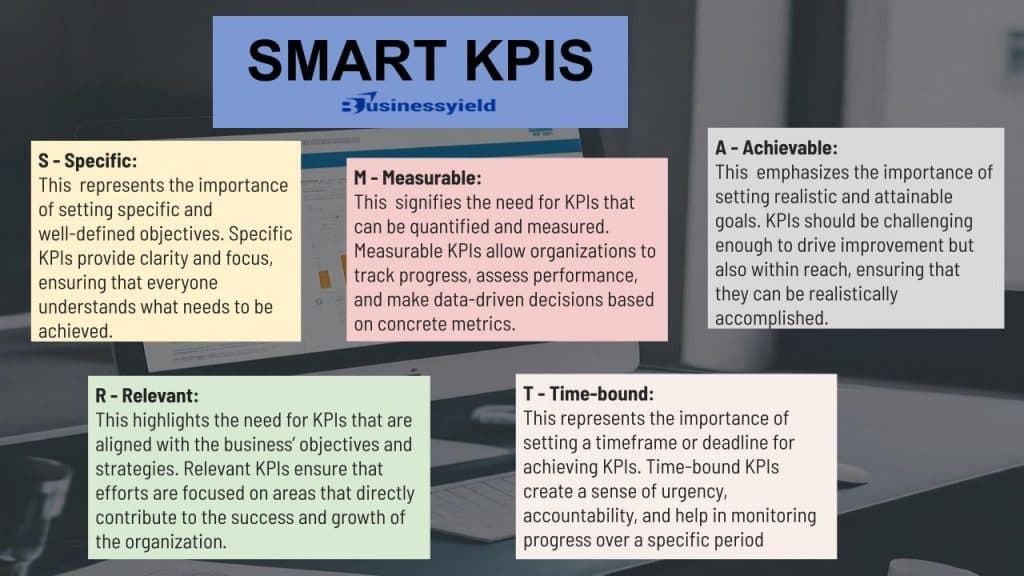
- They are usually developed using the SMART system (Specific, Measurable, Achievable, Realistic and Time-bound.)
- KPIs can be leading or lagging in nature.
- KPIs are lacking in value when used alone but they play a crucial role in supporting the business strategy!
How to Choose the Best Key Performance Indicators for Your Small Business
To achieve your business objectives, I recommend that you develop your KPIs. Note that one’s objectives may differ significantly from another. While creating KPIs, I recommend that you make sure they adhere to these four standards:
#1. They are actionable:
Your key performance indicators (KPIs) should clearly and tangibly illustrate the changes your company needs to make.
#2. It should be measurable:
Monitoring your KPIs should be easy for you. The most effective KPIs are simple to compute and analyze. Therefore, I believe that KPIs ought to be precise, measurable measurements.
#3. Your KPIs must be timely:
Comparing it with historical data won’t provide you with an accurate picture of the situation right now. The only way to make old data meaningful is to compare it with new data.
#4. They must have an effect on profitability:
Enhancing your KPIs should lead to a move closer to your objective, whether that be increasing net profit margins or client retention and satisfaction.
Pros of Key Performance Indicators
Here, I will show you some of the advantages of using Key Performance Indicators in your small business:
- They provide management with numerous opportunities to learn about how a firm is doing.
- They aid in holding workers responsible for their deeds.
- KPIs can inspire workers to reach goals when they see a favorable challenge.
- KPIs enable a business to establish goals and track its progress toward those targets.
Cons of Key Performance Indicators
Here, I will show you some of the disadvantages of using Key Performance Indicators:
- KPIs require continuous monitoring if you want to get accurate data.
- They also encourage managers to ignore other strategies and focus on KPIs.
- When KPIs are not reasonable, it discourages employees and leads to low morale and productivity.
Leading and Lagging KPIs
When looking at how to use KPIs in your small business, you may also frequently come across the terms “leading and lagging KPIs.” These words are frequently used in the business world, and I will show you their meanings and how they vary for your small business to develop KPIs that work.
What are Leading KPIs?
A leading KPI is a KPI that forecasts change within the business or organization. They can signify an initial result that is favorable or negative, and they are a measurable component that changes before they begin to follow a trend or pattern.
However, I think they have a limitation as they don’t necessarily provide a true picture of the future because they only take into account the company’s current performance, not its position in the market at the end of the month or year.
What do Leading KPIs indicate?
- The percentage of growth
- The percentage of growth in new markets
- Number of viewers or visitors on the website?
- The number of new visitors or customers
Finally, for a small business, I know leading indicators are helpful. However, you must also consider the lagging KPIs if you want to obtain a more complete picture of your company’s performance both now and in the future.
What are Lagging KPIs?
Lagging KPIs are an output-oriented approach that tracks the success of a small business. You can gauge the degree of success of individual components within your business structure by considering the business’s performance in addition to the indications listed below. They will measure this performance after the business has followed a trend or pattern, as opposed to leading KPIs, which confirm how the business will perform going forward if it continues in this manner.
What can Lagging KPIs indicate?
- It indicates if there is growth in annual sales.
- What are the annual sales?
- The annual net income
- It indicates any growth in the annual net income,
- The gross margin.
- The earnings before interest, taxes, depreciation, and amortization
When applied appropriately, they can offer you distinct perspectives on how your small business is doing in the market and where it might end up. The patterns that the KPIs outline must be followed, whether they are leading or lagging, for you to be successful and gain a clear understanding of where your company will be in a certain amount of time.
Top 15 Examples of Key Performance Indicators for Small Businesses
For your small business to thrive, you must regularly monitor and analyze these key performance indicators to make informed decisions and drive growth. These KPIs are:
#1. Net Profit
This is an easy starting point. Net profit is the total revenue less all costs, and it is often monitored on a monthly basis. One important financial metric is net profit. The amount of profit you make characterizes your small business.
#2. Net Profit Margin
The net profit margin is the percentage of profit earned over revenue. It can be calculated as follows: net profit = net profit/revenue. It is a useful year-to-year comparison to measure the success of your small business.
#3. Gross Profit Margin
Gross profit margin does not include overhead costs like marketing, sales, and administration. The gross profit is the total revenue minus the cost of production or service. Therefore, a high gross profit shows that your business will make a profit as long as other costs are under control.
#4. Quick Ratio
This is the ability of a business to use its most liquid assets to pay its short-term debt. This is comparable to cash flow, which is frequently identified as a primary cause of small business failure. Therefore, a small business should have enough cash on hand or enough assets that can be turned into cash quickly enough to cover its liabilities.
#5. Customer Acquisition Costs
Customer acquisition costs are the sum of money required to sign a new client. This KPI is simple if you are selling comparable products. However, selling a wide range of goods and services makes this more challenging. When setting a marketing and sales budget, established businesses typically benefit more from this KPI.
#6. Monthly Recurring Revenue
This KPI is beneficial for businesses that offer subscriptions or services. In certain cases, this can be computed to yield an average monthly recurring revenue over a rolling six-month period. For planning purposes, knowing the amount of “guaranteed” income is helpful.
#7. Customer Satisfaction
Most small businesses make use of sophisticated point-of-sale methods to collect daily data that might be helpful in forecasting customer behavior. A yearly customer satisfaction survey for low-volume services or consulting sales could be used for this. Communicating with clients is essential in any case.
To know more about customer satisfaction, read: CUSTOMER SATISFACTION: The Ultimate Guide For Startups In 2023 and How Customer Support Can Increase Customer Satisfaction.
#8. Website Traffic/Interaction
Understanding how potential clients and consumers use a website is crucial for Internet businesses. To do this, there are numerous advanced tools available. Selecting the appropriate measurements can be challenging. Although the number of visitors per day may seem intriguing, is it really helpful? Even though there may be fewer click-throughs, they are almost certainly more useful. The secret is to observe trends and recognize behavioral patterns.
The quantity of likes on Facebook or Instagram is frequently used as a “vanity” metric. You might not be able to know what your customers are truly thinking by just counting likes. Social media is helpful, particularly for building brands, but it’s important to track the interactions that lead to engagement. How many clicks are made to the website? What number of inquiries were made?
#10. Number of Customers
One helpful KPI to employ as a growth indicator is the number of customers. It must, however, be used with other metrics like revenue or profit, particularly if there is a significant price difference between the items and services.
#11. Net Promoter Score
This is usually used by small businesses in the retail industry, but it has been used more extensively recently. How likely are you to suggest our business to your friends or colleagues? is a question you should ask your customers. On a scale of zero to 10, where 10 is highly likely and zero is extremely unlikely, rank the responses. Referrals or word-of-mouth sales are always the easiest to follow up on.
#12. Customer Complaints
Customer complaints refer to the number of dissatisfactions that your customers show towards your business. Note that if a complaint is handled promptly and effectively, it can lead to a satisfied customer. Additionally, customer complaints are also a great source of free, helpful information that can be used to enhance goods and services.
#13. Employee Satisfaction
Satisfied workers always translate into satisfied customers. Furthermore, this isn’t limited to the service and retail sectors. Belief in the goods or services being sold is a common source of happiness at work.
Check out this interesting article on EMPLOYEE SATISFACTION: Survey Questions and Best Practices
#14. Employee Retention Rate
Hiring competent employees is expensive. Particularly when advanced training or high skill levels are needed. Therefore, when your business begins to experience a declining rate of staff retention, this suggests that there is room for improvement.
#15. Energy Consumption
Energy use serves as an example for a number of “new” environmental KPIs. Naturally, a lot of clients and staff members look up environmental credentials. I prefer to work for or patronise businesses that are actively pursuing environmental goals. One “green” KPI that promotes cost reduction and gives the proper impression is energy usage.
Businessyield Checklist for Choosing the Best Key-Performance-Indicators Tools
The Best KPI Tools for Small Businesses in 2024
I will examine each of the best KPI tools in detail to discover what they have to offer and for you to determine the best for your small business.
Here we go.

#1. Klipfolio
Klipfolio is a popular real-time cloud-based KPI software with over 50,000 users. It is a business intelligence (BI) platform that is lightweight and strong, assisting you and your team in making informed decisions to expand your company. KPIs that are important to you can be tracked, visualized, understood, and shared.
Features of Klipfolio
I recommend this software because it offers the following KPI features:
- Custom connectors: Link the IT stack of your organization to hundreds of data sources.
- No Coding: It eliminates coding problems and gives you immediate access to all of your metrics.
- Comparative Functionality: It analyzes trends from the historical data vault and compares statistics across time periods.
- Real-time insights into the operations of your brand’s departments—sales, marketing, finance, user experience, and administration—are available with the Live Klipfolio Dashboard.
- Create and share interactive reports and data visualizations with important stakeholders with ease.
Klipfolio Pricing
Free: $0/month
Pro: $249/month
Plus: $99/month
#2. Tableau
Tableau Software, the industry leader in interactive data visualization and business intelligence, is a gold standard for visual data analytics. Your business data is brought to life by the platform so that you can see and comprehend it with ease. It is one of the business intelligence solutions that I know that has the fastest growth rates available.
Even Salesforce purchased Tableau after realizing the tool’s commercial potential.
Features of Tableau
- It offers the drag-and-drop feature, regardless of your level of expertise.
- Data Blending: Use Tableau Prep to automate, clean, shape, and mesh your data workflows.
- Exchange and Collaborate: You can securely exchange data with decision-makers for management, feedback, and shared insights by using a variety of business collaboration tools.
- It offers hybrid connectivity: You can revive in-memory using encrypted extracts while receiving real-time analysis.
- Interactive Dashboards: With an easy-to-use drag-and-drop tool, create beautiful interactive displays and statistical models powered by AI.
Tableau Pricing
- Tableau Viewer: $12/month
- Tableau Creator: $70/month
- Tableau Explorer: $35/month
#3. Sisense
Sisense is one of the best AI-driven and analytics solutions for small businesses. The tool is a painless end-to-end platform for complex data analysis and visualization. Sisense is powerful. It picks data in real-time from many sources, merges it, and allows non-techies to build stunning reports.
Features of Sisense
- BI Dashboard: You can take complex data from various sources and change it into actionable business intelligence reports and dashboards.
- It offers flexible analysis: Select how you want to see and analyze your data, from a drag-and-drop interface to self-service using Python, SQL, and R.
- Customer Service: Monitor customer service-related KPIs, including call center statistics, support tickets, and the NPS score for customer happiness.
- Manage Every Type of Data: Handle data in real-time, cached, data lake, in-app, on-premise server, and data warehouse formats from any source.
- You can track financial KPIs, such as profits, losses, acquisitions, and investment analysis, by keeping an eye on your finance department.
Sisense Pricing
Standard Plan: $83 per user/month
Professional Plan: $160 per month for unlimited users
#4. Qlik Sense
Qlik Sense is a feature-rich, next-generation KPI dashboard program. With it, you can transform mountains of data into useful business insights with the aid of this software, which is an agile tool for data visualization and discovery. It is a powerful, unique artificial intelligence associative analytics engine on a cloud-based commercial platform.
Features of Qlik
- Self-Service Visualization and Discovery: No matter the size of your data, you can quickly combine, analyze, and visualize it.
- Real-Time Advanced Analytics: This feature enables small business users to contextualize company KPIs in real-time and engage with data from external sources.
- Mobile Analytics: Your analytics dashboard is accessible from anywhere on iOS and Android smartphones, thanks to Qlik’s mobile-first platform.
- Reports and notifications: Give stakeholders comprehensive, data-driven reports and notifications for proactive dashboard monitoring.
- Dashboard with Interactive Features: Every piece of the dashboard may be interacted with to provide additional insight into a particular KPI.
Qlik Pricing
Business: $30 per user/month
SaaS: Contact sales for custom pricing
#5. Scoro
Scoror is an all-inclusive project management tool. It enables groups and teams to collaborate more successfully, exchange data, automate invoicing, and streamline quoting. In addition to being a well-respected management tool, Scoro functions as a powerful KPI dashboard tool.
Features of Scoro
- Live KPI Dashboards: Using the KPIs and metrics you’ve selected, keep an eye on the health of your company in real time.
- Google Analytics connector: Make use of the convenient Google Analytics connector to automatically share data between Scoro and Google Analytics.
- Integrated View: Track and manage all aspects of your sales funnel, including forecasts, projects, budgets, sales, team performance, and more, from one location.
- Shareable Dashboards: Make customized shareable dashboards containing everyone’s KPIs and goals for each department in your business.
- Integrations: By linking Scoro to hundreds of external products, you may accelerate the automation of your data workflow.
Scoro Pricing
Essential (5 users): $26 per month
Sales Hub (5 users): $37 per month
Work Hub (5 users): $37 per month
#6. Grow
Grow has a lot of positive reviews attesting to its superior business intelligence software. It is a top choice for full-stack BI performance management software.
The best thing about it is that its KPI metrics are visible without requiring you to tinker with intricate code.
Features of Grow
- To get a complete picture from a single screen, you can connect, preserve, and combine data from hundreds of sources.
- Custom Dashboard: Choose the KPIs you want to monitor and set up custom views to see the data in the format that suits your needs.
- Accounting and Finance: Keep an eye on key performance indicators (KPIs) for accounting and finance, including growth, cash, and revenue, as well as integrations for invoicing.
- Social media: Create links between and compile content from all of your Facebook, Instagram, Twitter, YouTube, and other social media accounts.
- Files: Supported file formats include Excel Spreadsheets, Smartsheets, OneDrive, Dropbox, Google Sheets, and Amazon S3 data imports.
Grow Pricing
Plans start at $50/month
#7. Bright Gauge
With Bright Gauge, you can manage your data effectively and simply, allowing your data to speak for itself. The platform unifies all of your business data and KPIs under one roof, eliminating data silos. Additionally, you receive new, user-friendly dashboards.
Features of Bright Gauge
I recommend this tool because it offers the following KPI features:
- Dashboards: Monitor and display any KPI from several dashboards to help you make wise business decisions.
- Personalized KPIs: Tailor your statistics display to exactly fit your situation.
- Calculated Metrics: Use operations like addition, subtraction, multiplication, and division to further analyze your data.
- Data Mashup: View all of your KPIs and metrics on a single, integrated dashboard, including those from your security solutions, PSA, RMM, and BDR.
- Client Reporting: Use automated KPI reporting to wow your clients and demonstrate the value you offer.
Bright Gauge Pricing
Standard: $289 a month
Enterprise+: $559 a month
Enterprise: $399 a month
#8. Simple KPI
The next KPI dashboard tool is Simple KPI, which is a cloud-based program that simplifies complex data, as its name suggests. “Data management doesn’t need to be complicated” is their catchphrase. As promised, the program is brimming with user-friendly data visualization tools that even non-techies may quickly become proficient with.
Features of Simple KPI
- Dashboard Views: To help you better explain your data to team members, you can view it as graphs, charts, league tables, and widgets.
- Excel Spreadsheets: Create eye-catching dashboards from your Excel Spreadsheet data to make it come to life.
- Export Tool: Generate comprehensive KPI reports in widely used file formats, such as Word, Excel, or PDF.
- Comprehensive Analysis Tools: To view your data from a variety of angles, use the dig down or up features.
- An intuitive interface that facilitates the management and sharing of data for users of all skill levels.
Simple KPI Pricing
$99 per month for everything
Unlimited users, dashboards, reports, and KPIs.
#9. Tap Clicks
TapClicks, a premier cloud-based business intelligence (BI) platform, provides digital marketing analytics and reporting to media firms, eCommerce brands, advertising agencies, healthcare organizations, and other businesses.
Note that by integrating all of your data sources, the KPI tool aids in the unification of your marketing and sales initiatives.
Features of TapClicks
I recommend this software because it offers the following KPI features:
- Marketing Operations: Monitor all of your campaigns, reports, workflows, and marketing data.
- Competitive intelligence: observe the SEM conversion funnel of your rivals.
- Calculations and Custom Metrics: With just a few clicks, you can create customized KPIs and metrics.
- Goals and Pacing: It allows you to align your campaign spending so that you can monitor your progress rather than just the final result.
- Select Reports: It allows you to share comprehensive reports across multiple channels and automate reporting in your small business.
TapClicks Pricing
Basic: $249 a month
Elite: $1,499 a month
Pro: $999 a month
#10. Databox
Databox is a popular KPI program that makes it easier for you to comprehend business operations. It gathers your data from several sources so you can track developments in real-time and find useful information to expand your business. Additionally, Databox has positive reviews from sites such as G2 Crowd and AlternativeTo, making it a favorite for small businesses. I recommend this tool for small businesses.
Features of Databox
- Integrated Dashboard: Combine KPIs and metrics from several sources into a single dashboard to save time and effort while switching between several platforms.
- DIY Dashboard Designer: Even if you don’t know how to code, you can create your own stunning KPI dashboards and see them in a variety of ways.
- Effective connections: To improve your data automation workflow, connect your preferred marketing, social media, sales, or other business tool through one of the more than 70 available connections.
- Performance Alerts: Receive timely notifications when your team reaches significant benchmarks or when something is amiss and needs quick fixing.
- Scorecards: Receive email, Slack, or push notifications on your mobile device with your most important KPIs.
Databox Pricing
Starter: $0/month
Performer: $289/month
Professional: $169/month
To know about the effect of AI in business, read: AI Application In Business Explained! (+Top 5 AI Tools)
What are the Key Performance Indicators in marketing?
Key Performance Indicators in marketing give you a better understanding of how effective your marketing and promotional campaigns have been. These metrics frequently track the frequency with which potential customers respond to a certain marketing channel by measuring conversation rates. Here, I will introduce some examples of KPIs for marketing are as follows:
#1. Website traffic:
This is a key performance indicator that measures how many people visit specific pages on a business’s website. With the use of this KPI, your management can gain a better understanding of whether web traffic is being directed toward prospective sales channels and whether clients are not being properly routed.
Read these articles to expand your knowledge on website traffic: WEBSITE TRAFFIC ANALYZER: Top 20+ Free Tools in 2023, HOW TO INCREASE TRAFFIC OF A WEBSITE: A Comprehensive Guide
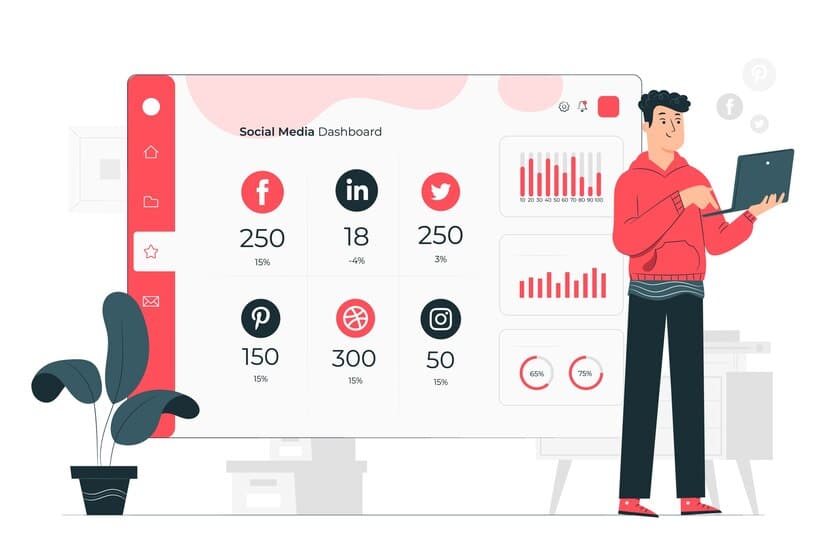
This KPI monitors the amount of time that users spend on the company’s social media pages, including views, follows, likes, retweets, shares, and engagement.
#3. The conversion rate of your call-to-action content:
This KPI focuses on targeted marketing campaigns that request specific behaviors from consumers. For instance, a particular campaign might nudge clients to take action before the end of a given sale date. To find out what percentage of consumers responded to the call to action, you must divide the total number of content deliveries by the number of successful interactions.
#4. Blog articles published per month:
This KPI just keeps track of how many blog articles your small business publishes in a specific month.
#5. Click-through rates:
This Key Performance Indicator counts the number of particular clicks made on email distributions. Some tools can keep track of the number of clients who clicked on a link, opened an email distribution, and completed a purchase.
Read Also: PAY PER CLICK ADVERTISING (PPC): Costs And Top 7 Agencies
What Does KPI Mean?
KPIs or Key performance indicators are collected, evaluated, and summarized in statistics that support decision-making. They may be as simple as a single figure or computation that represents the activity for a given period, like “300 orders in June.” KPIs don’t bring any value to a company by themselves. Nonetheless, small businesses can make use of this data to make better-informed choices regarding operations and tactics.
What Is an example of a KPI?
Revenue per customer is among the most fundamental KPIs (RPC). For instance, your RPC would be $100 if you had 10 clients and $1,000 in revenue per year. You can use this KPI to monitor the RPC of your business over time
What Are 5 of the Most Common KPIs?
KPIs differ from business to business, and some are more suited for particular businesses than others. Generally speaking, these are the top five KPIs that are used:
- Revenue growth
- Revenue per client
- Profit margin
- Client retention rate
- Customer satisfaction
How Do You Measure KPIs?
Yes, you can measure KPIs by using reporting tools, and business analytics software like the ones mentioned above. This covers every step of the process, including gathering data from dependable sources, storing it securely, cleaning it to standardize its format for analysis, and doing the math. Lastly, software for reporting or visualization is frequently used to report KPIs.
What makes a good KPI?
A good KPI should provide clear, objective information about the progress made toward a target. It offers a mechanism to gauge performance over time and tracks and assesses variables like effectiveness, quality, timeliness, and performance. A KPI’s main objective is to assist management in making better decisions.
15 Most Profitable Small Business to Start in 2024
61+ Small Business Ideas: 2024 Expert Picks + Free Templates
11 Best Digital Marketing Companies for Small Businesses