Imagine you’re running a bakery. You spend hours crafting delicious pastries, and after a long day, you tally up your sales. But a simple sales figure doesn’t tell the whole story. How efficient is your business? Are you turning a profit on the ingredients you buy? This is where the Return On Sales (ROS) comes in.
ROS is a key financial metric that helps you assess your bakery’s profitability relative to its sales. In simpler terms, it reveals how much profit you’re generating for every dollar of sales of your mouthwatering muffins and croissants. Let’s go into how to calculate and interpret return on sales, turning you from a passionate baker into a financially savvy business owner who understands not just the art of baking, but also the business of sales and profit.
I’ll explore what factors can influence your return on sales (ROS), and how to use this metric to compare your bakery’s performance against industry benchmarks or even your local competitors. In the end, you’ll be equipped to analyze your ROS and identify areas to improve your bakery’s profitability, ensuring your delicious treats continue to fly off the shelves and your bottom line stays healthy.
Key Point:
- Return on Sales (ROS) is a vital financial metric for bakeries, revealing the profitability of each dollar of sales and providing insights into business efficiency.
- Calculated by dividing operating profit by net sales, ROS indicates how effectively a bakery is turning sales into profit, offering a snapshot of financial health.
- ROS differs from Earnings Before Interest and Taxes (EBIT), with EBIT representing profit before interest and taxes while ROS focuses on profit per dollar of sales.
- Understanding ROS versus Return on Investment (ROI) is crucial; ROS assesses overall sales profitability, while ROI evaluates the return from specific investments like new equipment.
- ROS, typically expressed as a percentage, helps bakery owners gauge profitability per dollar of sales, facilitating comparisons, strategic decisions, and performance analysis over time.
What is A Good ROS Ratio?
Return on sales, or ROS for short, is a metric that looks at how well a company is managing its operations. It compares the operating income to the net sales and presents the result as a percentage. Essentially, ROS tells you how much profit a company is making for every dollar it generates in sales. It’s like peeking into the efficiency of a business.
When ROS goes up, it’s a good sign – it means the company is getting better at using its resources to make money. But if ROS goes down, it might mean trouble is brewing financially. ROS is closely linked to a company’s operating profit margin, and understanding it can give you valuable insights into how well a business is performing.
READ ALSO: Investment Value: Definitions, Types, And Calculation
The Return On Sales (ROS) Formula
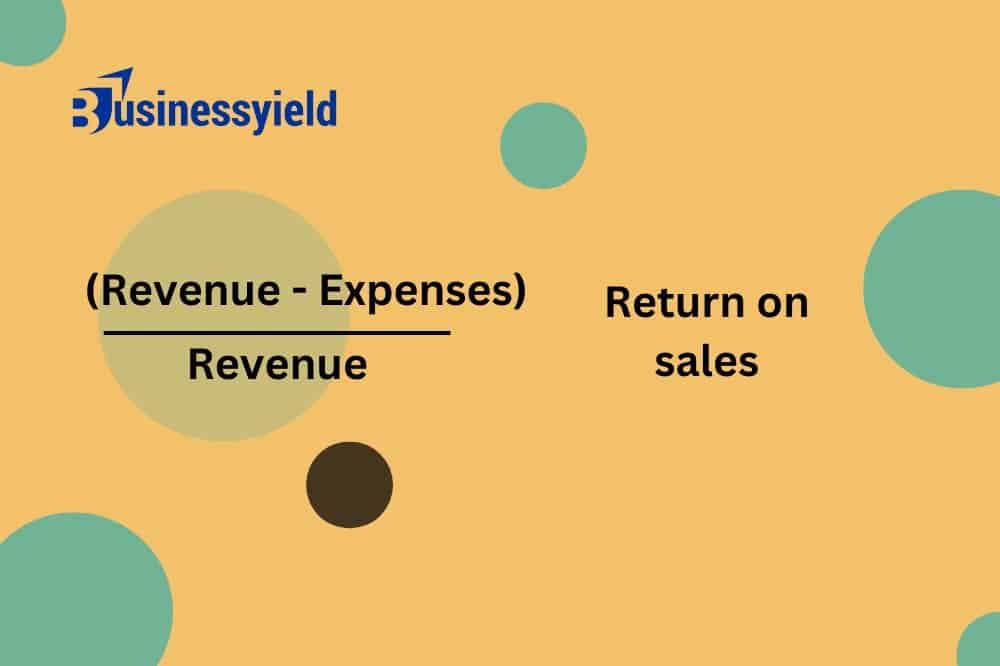
ROS= Operating Profit (Revenue-Expenses)/Net Sales (Revenue)
where: ROS=Return on salesOperating Profit is calculated as earnings before interest, or EBIT.
Now, let’s break it down:
- Revenue-Expenses also known as Operating profit is the amount of money left over after all expenditures, such as supplies, wages, and rent, have been deducted. It is sometimes referred to as “profit before interest and taxes.”
- Total Sales Revenue: The total amount of money produced by the firm from the sale of its products or services.
Is EBIT The Same as ROS?
EBIT? ROS? They both sound important, but are they the same thing? Not quite! It can get confusing, so let’s break it down. Imagine you run a clothing store. EBIT, which stands for earnings before interest and taxes, tells me your profit after accounting for the cost of those clothes, salaries, and rent – basically, the money you make from running the store before the government takes a bite and you pay for loans.
ROS, on the other hand, uses that EBIT number, instead of comparing it to your total expenses, it focuses on how much profit you generate per dollar of sales. It’s like a baker figuring out how much profit each croissant brings in, not just how much money they have left after buying flour and butter.
So, EBIT is a stepping stone, a part of the equation we use to calculate ROS, the ultimate profitability metric. Think of EBIT as your profit after the bake sale, and ROS as the profit per cupcake you sold. Now you can see why they’re connected, but not identical!
READ ALSO: EARNINGS BEFORE TAX (EBT): Overview, Formular, Importance
What is The Difference Between ROS and ROI?
Ah, ROS and ROI. This are two financial terms that can sound similar, but track very different things. ROS (Return on Sales) focuses on how efficiently you turn sales into profit. It tells me how much profit I squeeze out of every dollar of sales i make. Imagine it as the efficiency of my bakery, am I turning a decent profit on all those cupcakes and cookies I’m selling? That’s what your ROS shows you.
While, ROI takes a broader view. It measures the effectiveness of a specific investment, like a fancy new oven I bought. ROI asks me, “For every dollar I put into this oven, how much extra profit am I generating?”
So, Let’s say your bakery makes $100 in sales and has expenses of $70 (ingredients, rent, etc.). Your ROS would be ($100 profit / $100 sales) x 100% = 30%. This means you’re profiting 30 cents for every dollar of sales. A higher ROS indicates you’re good at managing your expenses and generating profit from your sales.
While for your ROI, you buy a fancy new oven for $5,000 that promises to increase efficiency. ROI helps you see if it’s worth it. Let’s say the new oven saves you $1,000 a year on electricity. The ROI on the oven would be ($1,000 profit / $5,000 investment) x 100% = 20%. So, it takes two years for the oven to pay for itself, but after that, it’s generating a positive return.
Understanding both ROS and ROI helps you make smart decisions. A high ROS means your core business is healthy, but a low ROI on an investment might mean it’s not worth the cost. By using both metrics, you can make up a winning financial strategy!
What Does 10% Return On Sales Mean?
Let’s break it down:
So your business/company’s ROS is 10%, which implies that your business/company makes 10 cents on every dollar of sales. ROS enables you to understand how effectively a firm converts its revenues into profits.
Understanding what factors contribute to that 10% is key. Are you selling high-margin products with low production costs, or are you squeezing every penny of profit out of a lower-margin business with tight controls on expenses? The answer will impact your next steps. A 10% ROS in the luxury goods industry might be fantastic, while it could signal room for improvement in a high-volume, low-cost retail setting.
A 10% ROS could be a sign of a healthy business model, especially if your development costs are high. But what if you see your competitor boasting a 15% ROS? Time to dig deeper. Maybe they have a more efficient sales team or have negotiated better deals with suppliers. Analyzing your ROS alongside industry benchmarks and competitor data will help you pinpoint areas for improvement.
Remember, a 10% ROS is just a starting point. The key is to understand the why behind the number and use it to make informed decisions that propel your business forward.
READ ALSO: INTEREST COVERAGE RATIO: Types, Formula, Examples & Analysis
Business Yield Return on Sales (ROS) Template
Can Return on Sales Be Negative?
You crunched the numbers, plugged them into the formula, and bam! A negative return on sales (ROS) stares back at you. Don’t panic! A negative ROS isn’t an automatic death knell for your business, but it’s a red flag demanding attention.
If the return on sales is negative, this indicates that the company lost money during the operating process. In other words, a firm that has a negative return on sales is unprofitable and inefficient. This might occur if the company has lower revenue or increased operational expenditures.
Now, here’s why it happens: a negative ROS means your expenses are eating away at your sales revenue, leaving you with a loss. Imagine this – you’re selling cupcakes, but the cost of ingredients, rent, and staff salaries is higher than what you bring in from sales. Several factors can contribute to a negative ROS. Maybe your pricing strategy is off, and your cupcakes are simply too cheap.
Or perhaps your overhead costs are ballooning – rent hikes, supplier price increases, or even excessive waste can tip the scales. But there’s a silver lining! A negative ROS can be a wake-up call to identify areas for improvement. Can you negotiate better deals with suppliers? Streamline operations to reduce waste.
A strategic price increase, if implemented carefully, might be the answer. The key is to analyze your costs and sales figures meticulously. Remember, a negative ROS doesn’t have to be your bakery’s fate. It’s a chance to roll up your sleeves, sharpen your business acumen, and turn things around!
Return on Sales Examples
Let’s imagine your company had $500,000 in sales and $400,000 in costs this quarter.
To calculate your return on sales, first calculate your profit by deducting your expenses from your income. In this case, you would have made $100,000 in profit. You would then divide that profit amount by your total revenue of $500,000, yielding a ROS of 0.20.
ROS is normally reported as a percentage, so in most circumstances, you would multiply the final value by 100 and use that figure to record your ROS — in this example, 20%.
This percentage reflects how many pennies of profit you make for every dollar of sales. Here, your ROS would be 20 cents on the dollar.
READ ALSO: WHAT IS ROI: Meaning, How to Calculate It, and Guide for A Business
Should Return on Sales Be A Percentage?
Expressing ROS as a percentage is crucial! this is why. By converting ROS to a percentage, we get a clear picture of our profit per dollar of sales. Think of it like a universal translator – a high ROS, say 15%, tells you you’re making a healthy 15 cents profit on every dollar of clothing sold. This is fantastic for comparing your performance across time.
Did your ROS jump from 10% to 12% last quarter? That’s a clear sign your profit margin is improving! Percentages also level the playing field. A small boutique and a retail giant can both express their ROS as a percentage, allowing for easy comparison – even if their overall sales figures differ vastly.
Finally, percentages make ROS a powerful communication tool. Discussing a 5% ROS with investors or your team instantly conveys your profitability, sparking important conversations about pricing strategy, cost control, and overall business health. So, while the raw numbers matter, expressing ROS as a percentage unlocks its true potential as a financial compass for your business.
Conclusion
Remember that bakery we discussed? Imagine after analyzing your ROS (return on sales), you discover it’s a bit lower than you’d hoped. This doesn’t have to spell disaster! Understanding your ROS empowers you to take action. Maybe you can negotiate bulk discounts with suppliers to bring down ingredient costs, or perhaps a strategic price increase on premium pastries can boost your profit margin.
The key is to use ROS (return on sales) as a springboard for improvement. Now you know exactly where to focus your efforts to turn that delicious passion into a flourishing business. Remember, ROS (return on sales) is just one metric, but a powerful one. By consistently monitoring and analyzing it, you can identify trends, celebrate improvements, and course-correct when needed.
So, the next time you tally up your sales, don’t stop there. Accept the power of ROS (return on sales) to unlock the true financial potential of your bakery and watch your profits rise alongside your perfectly golden croissants.
How to Choose the Perfect Client Gift to Improve Client Relationships
THE ROLE OF OTE COMPENSATION IN MOTIVATING TEAMS
How to Choose the Perfect Client Gift to Improve Client Relationships