The use of candlestick charts has been trending in recent times and is being adopted by the majority of people who are new to trading. It’s not a surprise, given their flexibility and the fact that they create a variety of patterns that are a sign of the probability of future prices that are either bullish or bearish. However, are they enough as a stand-alone approach to price-action in trading?
The majority of candlesticks are not trustworthy, but there are some patterns that are reliable enough to be a part of the trading strategy. The type of candlesticks that can be utilized is dependent on factors such as the type of market you trade in, the timeframe you trade, and other circumstances that pertain to your strategy for trading.
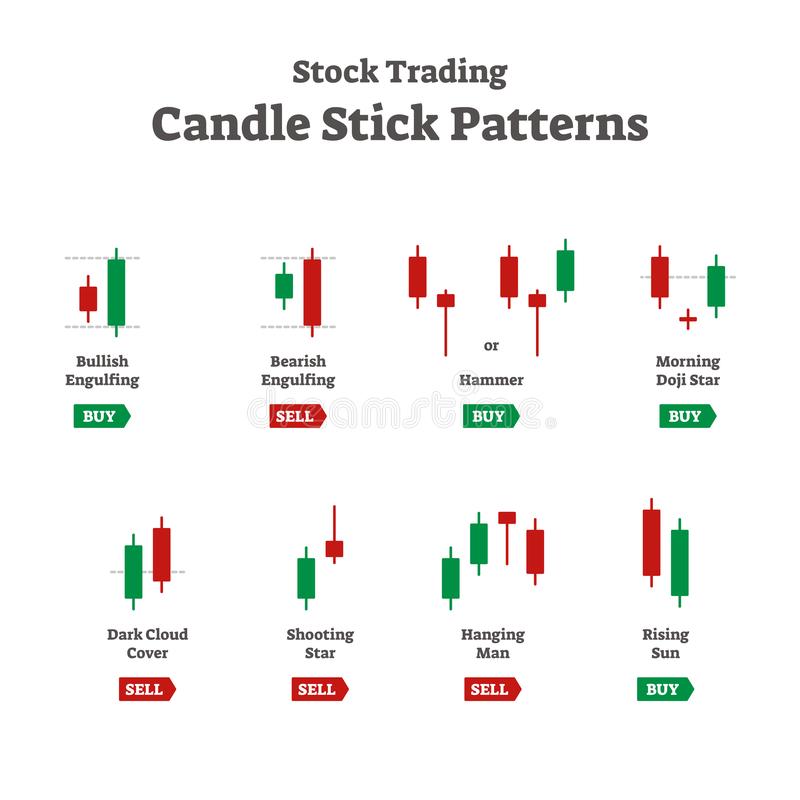
There are numerous kinds of candlestick patterns believed to be a sign of anything from imminent price reversals or continuing the trend currently in place. In most cases, they are provided with rational reasons for what it could mean to predict a result. However, to get an accurate and clear picture of what is going on in the market, you need more than just candlesticks.
The extensive guide on price action from the Elite CurrenSea team offers impressive insight into what should be used in a regular trading strategy. The guide obviously covers the majority of candlestick patterns, including its basic and its continuation and reversal on bearish and bullish markets. However, the guide also dictates that traders utilize other factors such as price swings, momentum, and corrections, price patterns, the path of least resistance, and flow versus resistance. For many reasons, the price action guide by Elite CurrenSea provides a great explanation of why candlesticks alone should not be relied upon. We will discuss these reasons below in the article.
What Is Wrong with Candlesticks as Stand-Alone Methods?
For certain traders, it shouldn’t be a surprise to learn that candlesticks don’t provide reliable signals for buying or selling by themselves. In order to be considered a signal worth taking action on, it is often necessary to add additional filters in order to eliminate patterns that don’t make sense. Here are a few examples of filters that can look like this:
- A high ADX Value: By requiring an ADX to be high, we can only consider signals that are observed in conditions of high volatility. This could have a significant effect on certain patterns!
- The direction of the long-term trend: Certain patterns only be effective only when the market is in either a bearish or bullish trend. This is typically the case for stocks and other markets, where bullish patterns generally are more effective when the market is trading over its 200-period moving mean.
- Volatility Conditions: Sometimes, looking closer at the size of the market may give valuable insight into the validity of a pattern and whether it is something to take action on or not.
There are many other kinds of filters we could name. However, these three are the most flexible ones.
A lot of traders use the same strategies and patterns across a variety of timeframes and quickly switch between bar settings in order to discover good setups. However, it’s rare to observe that trading patterns are effective across a variety of timeframes. In determining the time frame works the best, there’s one general rule of thumb that is useful to be aware of:
Daily bars are generally more secure than bars that are only available during the day. Here are two primary reasons:
- Randomness is less influential on price in shorter time frames; random and short-term market changes will have greater impacts on the results of one bar. Because daily bars comprise numerous transactions, we’ll be close to an overall average for the random movements, which provides more accurate information about the market’s fluctuations.
- It is noticed more as the major market players, including hedge funds and other such institutions, employ the daily bar to make choices regarding their activities. This means that any possible signals from this daily timeframe are likely to be given more attention, and the levels of support and resistance are more closely watched by market participants and grow more pronounced as a result.
All in all, candlestick patterns aren’t nearly as reliable as you might believe at first glance. But this doesn’t mean you can’t create great strategies with these patterns. Make sure you employ backtesting to ensure you are certain that you’re getting the odds to your advantage.