If you are trying to know the significant difference between two mean sample data sets as it relates to given variables, you should check out the t-statistic. Be it in the education field, science, or even something business-related, we all try to test our hypotheses and guesswork at one point or another. Interestingly, t-statistics is one of the tools used to test our assessment of data. A t-statistic, often known as a t value, describes the relationship of a set of samples to a population set. It is used to reduce vast volumes of data to a single value. This guide covers the formula, types, how to interpret its value, and also the uses of t-statistics.
What Is T-Statistic?
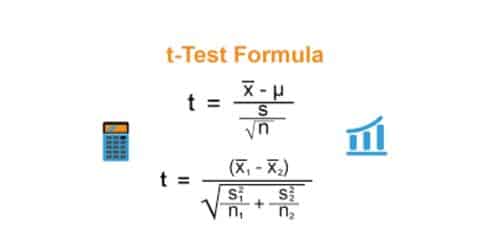
The t-statistic measures how significant the difference between two sample means is relative to the variability in the data. It’s a standard tool for evaluating hypotheses about the significance of differences between samples.T Statistic Formula
Formula For Calculating T Statistic:
t = (x̄1 – x̄2) / (s√((1/n1)+(1/n2)))
Where:
x̄1 and x̄2 are the sample means of the two samples
s is the pooled standard deviation of the two samples
n1 and n2 are the sample sizes of the two samples
The t-statistic is calculated by subtracting the mean of one sample from the mean of the other sample. Then, you have to divide it by the standard error of the difference between the two means. Error is estimated by adding the samples’ standard deviations together.
Example of Calculating T Statistic
Suppose we want to test whether the mean weight of apples from two orchards is the same. We take a sample of 10 apples from each orchard and record their weights. The data is as follows:
Orchard 1: 100g, 110g, 120g, 130g, 140g, 150g, 160g, 170g, 180g, 190g
Orchard 2: 90g, 100g, 110g, 120g, 130g, 140g, 150g, 160g, 170g, 180g
We can calculate the sample means and standard deviations as follows:
x̄1 = 150g
x̄2 = 130g
s1 = 36.06g
s2 = 36.06g
We can now calculate the t statistic using the formula:
t = (150 – 130) / (36.06√((1/10)+(1/10))) = 2.79
To determine whether this t statistic is significant, we would compare it to a critical value from the t-distribution with 18 degrees of freedom (10 + 10 – 2). The null hypothesis that the orchards’ mean weights are equal can be rejected. But it’s on the condition that the t statistic is greater than the critical value.
Overall, the t statistic is a useful tool in hypothesis testing. This is because generally, it helps us to determine whether the differences we observe in our data are statistically significant.
Understanding T-Statistic
T-statistic is the proportion of the difference between the estimated and predicted values of a parameter divided by the standard error of the estimate. It’s common in verifying student hypotheses in research work and the findings. Generally, they are used to ascertain whether or not to accept the null hypothesis. When the sample size is small or the population standard deviation is unknown, the t-statistic is employed instead of the z-score. If the population standard deviation is unknown, the t-statistic can be used to estimate the population means from a sampling distribution of sample means. It is also used in conjunction with the p-value to determine the statistical significance of a result in a hypothesis test.
The critical value of the t-statistic depends on the sample size, the level of significance, and the degrees of freedom. A larger t-statistic value indicates a greater difference between the means of the two groups being compared, and a smaller p-value indicates a higher level of significance.
In general, if the calculated t-statistic value is greater than the critical value from the t-distribution, then the null hypothesis is rejected in favor of the alternative hypothesis. The exact cutoff for a “good” t-statistic value depends on the significance level and degrees of freedom, but generally, a t-statistic with an absolute value greater than 2 is considered statistically significant at the 5% level of significance.
It is important to note that the interpretation of a t-statistic value also depends on the specific context of the study and the effect size. A large t-statistic may be significant in one context but not in another, depending on the magnitude of the effect being studied. Therefore, it’s always important to consider the context and effect size when interpreting the significance of a t-statistic value.
What Is the T-Statistic vs P-Value?
The t-value is a tool to quantify the difference between population means for each test, and the p-value assesses the likelihood of finding a t-value with an absolute value at least as great as the one observed in the sample data if the null hypothesis is valid.
What Does the T Statistic Tell You in Regression?
T-test statistics can be used to explore the relationship between the outcome and the variables used to predict it. To determine whether or not the slope or coefficient in a linear regression analysis is equal to zero, a one-sample t-test is performed. While performing linear regression, a one-sample t-test is used to reject the null hypothesis that the slope or coefficient is 0.
How to Calculate a T Statistic
Determining your t-test is relatively easy if you use the following steps;
- Find the sample mean of your data set
- Next, determine by calculation, of the population mean.
- Using the right formula calculate the standard deviation of the sample data
- Calculate the t-statistics using the data from steps 1-3 and the sample size using the calculation above.
How Do You Know if T Stat Is Significant?
Statistical significance is indicated when a t-score is significantly different from the mean. That is, it needs to be highly dissimilar to the value of the distribution’s mean, which is unlikely to happen by coincidence if the two are unrelated.
What are the three types of t-tests in statistics?
The three types of t-test statistics are one-sample t-test, two-sample t-test, and paired t-test and they are used to compare means.
What Does a Large T-Statistic Tell You?
If t has a high value (a high ratio), then the observed discrepancy between the data and the hypothesis is greater than what would be predicted if the treatment had no effect. In statistical analysis, the t-score (or t-value) is most often used to show how different or similar two groups are.
What Is a Good T Statistic Value?
Most often, T-values between +2 and -2 are considered acceptable. The bigger the t-value, the more certain we are that the coefficient is a good predictor. If the t-value is low, the predictive power of the coefficient is weak.
What Is the Difference Between Z and T Statistics?
The Z-test and the T-test are both statistical procedures for analyzing data; both have uses in science, business, and other fields; yet, they are distinct from one another. When the mean (or average) and the variance (or standard deviation) of the population are both known (as they usually are), the T-test can be used to test the null hypothesis that they are not significantly different from one another. In contrast, the Z-test is a normal one-way analysis of variance test.
Z-Test
When the sample size is big, the variances are known, and the Z-test is used to determine if two population means are different, the test is considered reliable and valid.
Z Test Assumptions
Generally, Z tests are based on the following assumptions;
- The results of each experiment can be considered separate.
- In terms of sizes, the size of the samples must be up to 30
- Assuming a mean of zero and a variance of one, the Z distribution is normal.
T-Test
The t-test is used in statistics and it’s mostly used when variance is not available. A T-test can be used to determine whether or not two data sets have different means.
T-tests, in conjunction with the t-distribution, are employed when sample sizes are limited and the population standard deviation is unknown. The t-distribution takes on a form that is highly sensitive to the degree of freedom. The term “degree of freedom” is used to refer to the number of individual data points that make up a specific dataset.
The term “degree of freedom” is used to refer to the number of individual data points that make up a specific dataset.
Assumptions of the T-test
The T-Test is based on the following presumptions:
- Small sample size
- Data points must be considered independent.
- The number of samples needs to be documented precisely.
Uses of T-Statistic
The two most common ways to use t-statistics are for Student’s t-tests, which are a type of statistical hypothesis testing, and for calculating confidence intervals.
A t statistic is an important number because, even though it is given in terms of the sample mean, its sample size doesn’t depend on the parameters of the population.
The following are some common uses of t-statistic
#1. Testing Hypotheses About Population Means:
The t-test is commonly used to test whether the means of two populations are significantly different. For example, a researcher might use a t-test to compare the mean weight of two groups of people, to determine if there is a significant difference in weight between the two groups.
Comparing sample means to a known population mean: In some cases, a researcher may want to test whether a sample mean is significantly different from a known population mean. The t-test can be used for this purpose, by comparing the sample mean to the population mean and calculating the t-statistic.
#2. Confidence Intervals
The t-statistic is used to calculate confidence intervals for population means. A confidence interval provides a range of values within which we can be reasonably confident that the true population means lies.
#3. Testing The Significance Of Regression Coefficients:
The t-test is used to test whether the estimated regression coefficients in a linear regression model are significantly different from zero. This is important in determining whether the independent variables in the model are having a significant effect on the dependent variable.
Overall, the t-statistic is a widely used tool in statistical inference, particularly in hypothesis testing and estimation of population parameters.
Other Statistical Test
Aside from the t-statistic, there are other approaches to measuring the authenticity
of a hypotheses findings, some of these are below;
#1. F-Value
First on our list is the F value. This work best when analyzing variance. An f-value demonstrates the statistical significance of the mean differences and hence shows whether or not there is a correlation between the groups’ variances. This statistical analysis compares the means of two or more samples that can be treated separately. With the f value, the findings can be accepted or rejected on two base;
First, the null hypothesis is accepted if the f-value is bigger than or equal to the inter-group variance. Secondly, the null hypothesis is rejected if the f-value is smaller than the variance in the sample groups.
#2. Z-Value
Aside from the t-statistics test, another relevant approach that anyone can use in measuring hypotheses is the Z-value test. When comparing two populations where the mean is assumed to be the same, this is a great choice. Professional may prefer this over a t-test because it yield a more accurate result.
The Z value can be obtained using the formula below;
z = (X – μ) / σ
#3. P-Value
Next on the types of approaches to testing hypotheses is the P value test. This very one has one purpose, and that is to reject or accept a null hypothesis. A lower p-value is more indicative of rejecting the null hypothesis, while a larger p-value is more indicative of confirming the null hypothesis.
A p-value test is a measure of statistical significance that is calculated using the test’s degree of freedom and an estimate based on the test’s alpha value. The degree of freedom can be calculated by taking the sample size n and subtracting 1. (n – 1). The p-value can be estimated by comparing the result to a specified alpha level.
Related Articles
- STATISTICAL ANALYSIS: Types, Techniques, and Purpose
- HR ANALYTICS: Importance, Examples, Courses, Jobs
- WHAT DOES SKEW MEAN: Meaning, Types, and Examples
- Liquidity Ratio: Types, Formulas, and Calculations
- Predictive Analytics: Definition, Examples, and Benefits
- Tesla Logo: History & The Meaning Behind the Logo
- FACE VALUES: Definition, Importance and Difference