As a business owner, understanding your customers and their journey is paramount to success. Customer journey analytics provides valuable insights into the entire customer experience, from the first interaction to the final purchase and beyond. Let’s discuss further what customer journey analytics is, its importance, and how businesses can leverage it to drive growth and improve customer satisfaction.
Customer Journey Analytics
Customer journey analytics is the process of analyzing the customer experience across every touchpoint in the customer journey. It involves tracking and analyzing how customers use channel combinations to interact with an organization. Customer journey analytics helps businesses understand how customers interact with their brand and make informed decisions based on customer behavior.
Why Do Companies Use Customer Journey Analytics?
There are several reasons why companies use customer journey analytics. They include:
- Customer journey analytics allows businesses to measure the impact of customer behavior on business outcomes, such as customer lifetime value, customer loyalty, and revenue growth.
- It helps businesses gain visibility into every important customer interaction and provides valuable insights to inform decision-making.
- Customer journey analytics encompasses advanced analytics methods such as predictive analytics, real-time analytics, and customer segmentation to provide actionable insights that can directly impact the bottom line.
- Customer journey analytics enables businesses to analyze and optimize customer journeys, identify sources of friction, and prioritize improvements based on the potential impact on customer experience and business objectives.
- It involves creating customer journey maps, collecting data on customer behavior, and defining success metrics and milestones along the way.
Components of Customer Journey Analytics
The components of customer journey analytics include:
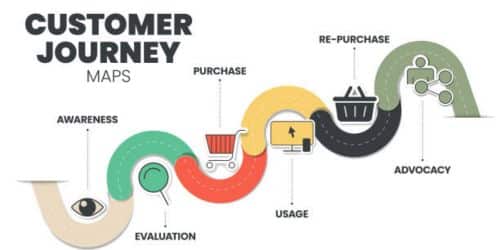
- Customer Journey Map: This visual represents every step the customer goes through with your business. It includes the buying process, user actions, emotions, pain points, and solutions.
- Analytics Tools: These tools monitor, track, and analyze website data, conversion data, and detailed data across multiple channels. Customer data platforms (CDPs) support customer journey analytics by building single customer views.
- Data Analysis: This involves making sense of the data and extracting insights to inform your business strategy. For example, an e-commerce company might identify that requiring customers to create an account to complete a purchase leads to the customer needing to complete the purchase.
- Testing New Strategies: Based on the insights gathered from the data analysis, new strategies are tested to enhance the customer journey experience. This could involve adding a guest checkout option, making the account creation process faster with fewer steps, and sending abandoned cart emails.
- Behavioral Segmentation: This is a form of customer segmentation based on how customers behave. It enables marketers to increase campaign performance through improved targeting.
- Real-time Modeling and Analysis: This involves analyzing data, generating actionable insights to optimize journeys, and continuously measuring the performance of CX initiatives. It powers real-time modeling and analysis and orchestrates actions to optimize journeys.
- Data-led Insights and Actions: Customer journey analytics allows you to see cause, effect, and concrete steps to change specific interactions or the entire customer journey. When customers react badly to specific processes or interactions, you can test how changes in your customer journeys affect their future decisions.
The Benefits of Utilizing Customer Journey Analytics for Businesses
Customer journey analytics offers several benefits for businesses, including:
- Measuring ROI on CX initiatives: Customer journey analytics allows businesses to measure the return on investment (ROI) of their customer experience (CX) initiatives. By analyzing customer journeys and identifying areas for improvement, businesses can track the impact of their efforts on customer satisfaction, retention, and revenue.
- Improving the customer experience: Customer journey analytics offers valuable insights into customer experience, identifying pain points, bottlenecks, and friction areas, enabling businesses to improve the overall experience through optimization, streamlining processes, and personalizing interactions.
- Reducing customer churn: Customer journey analytics helps predict customer behavior based on past actions, enabling businesses to identify customers at risk of leaving and take proactive measures to retain them. Businesses can increase customer satisfaction and loyalty by personalizing interactions and addressing customer concerns, reducing churn rates.
- Boosting revenue: Understanding the customer journey and identifying barriers to transactions optimizes processes, improving conversion rates and cross-sell and upsell opportunities. Personalized messaging and guest checkout options enhance customer experience.
- Increasing operational efficiency: Customer journey analytics helps businesses identify trends, optimize operations, and improve efficiency by identifying areas for assistance and investing in self-service options.
How to Implement Customer Journey Analytics
To effectively implement customer journey analytics, follow these steps:
#1. Create User Journey Maps
User journey maps visually represent customers’ steps when interacting with a business. These maps help businesses understand the customer journey and identify touchpoints for improvements. This can be done using prototyping tools or Post-it Notes to visualize user actions. For example, suppose to measure the journey of playing a song on a music app like Spotify. In that case, you need to create the entire journey map, including steps like going to the website, downloading the app, creating a login, searching for a song, and playing the song.
#2. Collect Relevant Data
Businesses need to determine and collect data about customer journeys. This can include data from various sources, such as website analytics, CRM systems, customer feedback, and transactional data. The data should be comprehensive and cover all relevant touchpoints and channels. For example, in the Spotify example, relevant data points include the number of searches, the number of songs played, and the duration of each song. Define the goals and milestones of the journey so you know what to measure and what success looks like.
#3. Analyze the Customer Data
Identify the data sources and capture behavioral data across the customer journey. Once you’ve collected the data, you can start analyzing it and measuring key metrics along critical flows of the journey. This will help you understand where customers spend their time, what’s causing frustration, and which behaviors lead to revenue-generating outcomes. Use this information to measure the customer journey effectively and identify areas for improvement.
#4. Define Success Metrics
Businesses should define success metrics and milestones along the customer journey. These metrics include customer satisfaction scores, conversion rates, average order value, and retention rates. Defining success metrics helps businesses track their progress and measure the impact of their initiatives.
Customer Journey Analytics Tool
A Customer Journey Analytics (CJA) tool is a tool that helps analyze and measure the customer journey through customer data points to improve the overall customer experience. It involves gathering and analyzing data on customer behavior across multiple touchpoints and channels over time to understand the impact of behavior on business outcomes.
Examples of a Customer Journey Analytics Tool
The examples include the following:
#1. Amplitude
Amplitude offers a Journeys feature that lets you view step-by-step breakdowns of the paths converted and dropped-off users take. It helps you understand the friction points in your customer experience and develop a strategy to fix them. By defining the start and endpoints of the journey, you can see what percentage of paths converted and what percentage dropped off.
#2. Mixpanel
Mixpanel is another customer journey analytics tool that provides insights into user behavior across different touchpoints. It enables you to track and analyze user actions in real time and build user journeys based on that behavior. This can help you identify bottlenecks, personalize interactions, and make data-driven improvements to the customer experience.
#3. Google Analytics
While not specifically a customer journey analytics tool, Google Analytics can also be utilized to analyze and measure the customer journey. By setting up conversion goals, creating funnels, and utilizing the Behavior Flow report, you can gain insights into how users navigate your website or app and identify areas for improvement.
Adobe Customer Journey Analytics
Adobe Customer Journey Analytics is an analytics tool that allows users to analyze and visualize data from the Adobe Experience Platform using the power of the Analysis Workspace. It can handle large amounts of data and is combined with the platform’s ability to hold various data schemas and types. Using the Experience Data Model (XDM), data can be uniformly represented and organized for exploration. Experience Query Services enables users to query and manipulate data using SQL-compatible tools and frameworks.
Customer Journey Analytics expands the capabilities of Adobe Analytics by offering cross-channel capabilities and removing limitations in previous versions. Adobe Experience Platform, on which Customer Journey Analytics is built, offers several other capabilities that centralize and standardize customer data and content from any system.
Features of the Adobe Experience Platform’s Customer Journey Analytics
They include the following:
- Multi-Channel Data Analysis: The platform allows you to bring in your customer data from any channel you choose, whether online or offline and analyze this data as you would with your existing digital data.
- Cross-Channel Capabilities: The platform expands the scope of Adobe Analytics by offering easy-to-use cross-channel capabilities, thus, allowing existing implementations from multiple datasets to be combined
- Data Transformation: Customer Journey Analytics includes Data Prep capabilities to help transform your data before putting it into the Adobe Experience Platform data lake.
- Unlimited Variables and Events: The concepts of eVars, props, and events no longer exist. Hence, data is primarily focused on dimensions and metrics, and datasets can have an unlimited number of unique dimensions and metrics
- Data Correction: You can use Adobe Experience Platform to remove or correct data
- Real-Time Data Processing: Any event data with a timestamp less than 24 hours old is streamed in. Any event data with a timestamp more than 24 hours old (even if it’s in the same batch as newer data) is considered backfill and will be ingested at a lower priority.
- Data Science Integration: Customer Journey Analytics lets you use data science to unlock deep insights and analysis
Customer Journey Analytics Hubspot
To create a report with customer journey analytics in HubSpot, you can follow these steps:
- Access the HubSpot Reports section. Go to “Reports” and ” Reports ” in the analytics tools. You should see a prompt for Customer Journey reports.
- Click “Create a report” to build your customer journey analytics report.
- Choose the touchpoints or elements you want to include in your visualization. For example, you can select life cycle stages to see how they interact with different stages of the marketing journey. Alternatively, you can create a general funnel to form submissions, such as page views.
- Drag and drop the relevant touchpoints onto the journey analytics canvas. For example, if you want to track page visitors as the first touchpoint, drag the “page visitors” element onto the canvas.
- Save your customer journey report by clicking “Save” and then choose the dashboard to which you want to add it. This will allow you to access and view the report later.
- Once the report is on the dashboard, you can interact with it and click on specific touchpoints to see the contacts associated with them. You can also export the data for further analysis.
Which Are the 5 E’s in the Customer Journey?
The 5 E’s in the customer journey are:
- Entice: This is the first stage where customers are drawn into the experience. It involves creating an invitation or trigger that catches their attention and sparks their interest.
- Enter: This stage is where the customer enters the experience. It is important to consider how customers interact at this stage and what events or actions bring them into the experience.
- Engage: The engage stage is the peak or core experience you want the customer to enjoy. It involves defining the tasks or actions the customer will perform while interacting with your product or service. Determining what constitutes a successful conversion at this stage is also important.
- Exit: Every experience has an ending; this stage is about managing the exit with grace and style. Consider wrapping up the customer journey and leaving them with a positive impression.
- Extend: The extended stage focuses on what comes after the initial experience. It involves identifying follow-up actions, such as emails or notifications, that keep the customer engaged and interested in future interactions.
What Are the Four Main Components of Customer Analytics?
The four main components of customer analytics are:
#1. Descriptive Analytics
This component analyzes historical customer behavior to understand how, what, and where customers shop. It helps companies understand past customer behavior and segment customers into actionable customer segments. Descriptive analytics focuses on answering questions such as “Which channels drive the most new customers?” and “What are our most profitable revenue channels?”
#2. Diagnostic Analytics
This component helps companies understand the “why” behind customer behavior. It goes beyond descriptive analytics to uncover the underlying reasons for customer actions. Diagnostic analytics can answer questions like “Why do customers think a particular product is not what they expected?”
#3. Predictive Analytics
This component involves using historical customer data to predict future customer behavior. It helps companies forecast trends and make informed decisions based on anticipated customer actions. Predictive analytics can answer questions like “What products are expected to decline in sales in the upcoming season?”
#4. Prescriptive Analytics
This component provides suggestions on how to influence or address customer behavior. It goes beyond predictive analytics by offering actionable recommendations to optimize customer experiences. Prescriptive analytics can answer questions like “How can social media campaigns and online ads increase sales by 25%?”
These four components work together to comprehensively understand customer behavior and enable businesses to make data-driven decisions.
What Is KPI in Customer Journey?
KPI stands for Key Performance Indicator. In customer journeys, KPIs are metrics used to measure and evaluate the success of customer experience initiatives and the satisfaction of customers throughout their journey.
Examples of KPI in the customer journey
#1. Customer Satisfaction (CSAT)
CSAT is a metric that measures the level of satisfaction customers have with their experience. It is often measured using surveys or feedback forms. A high CSAT score indicates that customers are satisfied with their experience, while a low score indicates areas for improvement.
#2. Average Resolution Time
This metric measures the average time a customer care agent takes to resolve a customer issue. A shorter resolution time indicates efficient customer support and can increase customer satisfaction.
#3. Net Promoter Score (NPS)
NPS is a widely used metric that measures customer loyalty and the likelihood of recommending a brand, product, or service to others. It is calculated based on a simple survey asking customers to rate their likelihood to recommend on a scale of 0 to 10. Based on their responses, customers are then categorized as promoters, passives, or detractors. NPS provides insights into customer advocacy and can help identify areas for improvement in the customer journey.
#4. Customer Effort Score (CES)
CES measures how easily customers interact with a company and obtain support or resolve issues. It is often measured through surveys or feedback forms and helps identify areas where the customer journey can be simplified and more efficient.
#5. Marketing Campaign Effectiveness
This KPI measures the return on investment (ROI) for marketing campaigns and assesses the impact of marketing efforts on the company’s overall growth. It helps evaluate how well the marketing campaigns align with customer needs and expectations, ultimately influencing the customer experience.
Related Articles
- TARGET CUSTOMER: Definition, How To Identify and Reach Them
- CUSTOMER SUPPORT SOFTWARE: Top 21+ Customer Service Software for 2023
- CUSTOMER INSIGHTS: Definition, Marketing, Analyst, Tools & Salary