The Aroon Indicator, developed by TusharChande in 1995, is a very productive mechanism that is utilized to indicate the price of a stock or an asset.
It is used to indicate if the price of a stock is trending or not. If it is trending, it indicates if its a strong trend.
The indicator shows when there is a strong uptrend or downtrend. It signals the beginning of a new trend, its strengths and can help anticipate changes from trading ranges to trends.
It is very important to traders because it helps them identify trends and develop the right strategies.
Get to know more about the Aroon Indicator strategy as you read through this article.
About Aroon
The Aroon indicator is made up of two lines: Aroon Up and Aroon Down. They are known as Bullish Aroon and Bearish Aroon.
The Aroon Up quantifies how long it has been since there has been a record of a new high within the specified period. If the current bar’s high is the highest within the user-defined number of periods before it, then the Aroon Up value is 100.
Essentially, it is a new high for the period. If not, it gives back a percent value indicating the time since a new high occurred for the specified period.
While the Aroon Down on the other hand quantifies how long it has been since there had been a record of a new low within the specified period.
If the current bar’s low is the lowest within the user-defined number of periods before it, the Aroon Down value is 100. Essentially, it is a new low for the period. If not, it gives back a percent value indicating the time since a new high occurred for the specified period.
The indicator generally has a 14-period (normally days) timeframe for determining the up or down line. The 14-day Aroon Up measures the number of days since a 14-day high.
A 14-day down measures the number of days since a 14-day low. It may seem as though 14 is the default but it is actually possible to set the period to longer time periods like 23 or 24.
It is vital to note that the “highest high” and “lowest-low” inputs do not really relate to the whole history of the asset, it just relates to the highest and lowest prices over a user-defined period.
This essentially means that all the prices that were recorded before this input are not taken into consideration.
RAD ALSO: Cash Flow Statement Direct Method: Overview, Examples, Pros & Cons
How it Works
The Aroon indicator is usually classified as an oscillator because the values of the Aroon fluctuates between upper and lower boundaries.
The Aroon indicators are somewhat different from normal momentum oscillators, which places their focus on price relative to time.
Aroon is a bit special because it places its attention on time relative to price. The Aroon indicator can be used by a technical analyst to identify emerging trends, spot consolidations, define correction periods, and anticipate reversals.
The fundamental assumption in this indicator is that a stock’s price will close regularly at new highs during an uptrend and regularly make new lows in a downtrend.
Crossovers could be signs of entry or exit points. Crossing above down can be a signal to buy. Down crossing below Up can be a signal to sell.
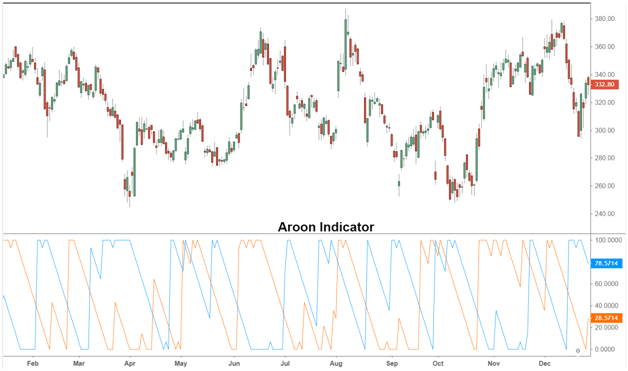
If you take a look at the extreme right side of the chart, you will see that it shows that the Aroon down indicator crossover is late in signaling a trend change from Aroon up to Aroon down. That will not occur until after nine days in a row in the market, during which the price would have fallen substantially.
The key points of reference are high points, low points and simultaneous positioning. The Aroon Indicator Rollercoaster tends to be sensitive to peaks and valleys of future pricing behavior, but inconclusive during ranging periods. The Aroon oscillator also tries to carry out pricing momentum direction changes.
Typical oversold and overbought conditions happen at extremes and are generally confirmed when the opposite indicator line is traversing the mid region at a similar moment in time.
The value of the indicator is in telling if a trend is intact, but a built-in debility is its delay in movement when there is a sharp change in price.
Nevertheless, a trader might have taken the downturn of the Aroon Up indicator as a sign of the uptrend weakening and combined with looking at price action, decided to make a judicious exit from the market prior to the actual Aroon Up/Aroon Down crossover.
RAD ALSO: Fiscal Agent: Best Practices & Detailed 2021 Guide
Aroon Indicator MT4
MT4 means Metatrader 4. The Aroon indicator is a technical indicator that is range bound and it produces numbers that range from 0 to 100.
There are three major things that technical analysts should look out for. They are;
- When it is close to or exactly on 0 it indicates a weaker trend.
- When it is close to or exactly on 100 it indicates a stronger trend.
- The position of the indicator when it is around 50 or exactly on 50. This signifies that it is on the middle ground and it could go either to the weak trend or strong trend.
When Aroon Up is above 50 and close to 100 and Aroon Down is below 50 this is a good indication of a strengthening uptrend. Likewise when Aroon Down is above 50 and close to 100 and Aroon Up is below 50, a strengthening downtrend may be at hand.
READ ALSO: Dip Financing: What is Dip Financing? (+ Free tools)
Aroon Calculation
The Aroon calculation depends greatly on the user- defined period.
For this particular example we will be utilizing a 14 Day Aroon
- Aroon Up = ((14 – Days since 14 day high)/14) x 100
- Aroon Down = ((14 – Days since 14 day low)/14) x 100
Identification of Trends
The main purpose of Aroon is to spot new trends as they are taking place. There are three processes to spotting or knowing when a new trend could be developing.
- The Aroon Up and the Aroon down cross each other: When this happens, it is an indication that a new trend might be starting.
- The Aroon lines will continue in other directions with one going above 50 towards 100 and the other remaining below 50.
- One of the Aroon lines will then hit 100.
Looking at the processes above, let us take a Bullish Trend for instance. In a Bullish Trend, the Aroon Up and the Aroon Down will cross.
Then, the Aroon Up will cross above 50 while the Aroon down crosses below 50. Finally, the Aroon Up will then hit 100 signifying the emergence of a Bullish Trend.
READ ALSO: Long Put: The Complete Beginners’ Guide (+Quick Tools)
Periods of Consolidation
Another great purpose of the Aroon indicator is its potential to identify periods of consolidation. This happens when both the Aroon Up and the Aroon Down have dropped beneath 50.
This indicates a period of sideways trading the reason being that neither the Bullish trend nor the Bearish trend has any power.
This is particularly true when both the Aroon Up and the Aroon Sown are moving at the same time. When they both drop in similar ways, a sideways trading range may be forming.
Generally, the shorter the period, the more the indicator will move around as very little data is put in and the range of possible values greatly reduces.
The Difference between the Aroon Indicator and the Directional Movement Index (DMI)
There are similarities between the Aroon Indicator and the Directional Movement Index which was made by Welles Wilder.
The DMI makes use of up and down lines to show the direction in which a trend is headed too just like the Aroon Indicator.
The major difference between the two of them is that the formulas of the Aroon Indicator mainly place their attention on the amount of time between highs and lows.
For the DMI, it measures the price difference between current highs/lows and older highs/lows. Hence, the major focus of the Directional Movement Index (DMI) is placed on the price, not time.
READ ALSO: Equity Analyst: Overview, Salary, Job, and all You Should Know
Best Aroon Settings
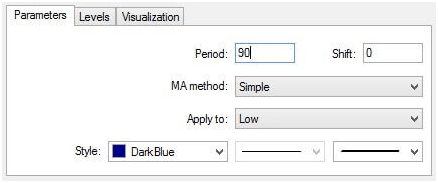
The best setting for the Aroon indicator as mentioned by TusharChande is to set it at 25 periods of data.
But take note that for short-term trading strategies, the aim is to look at the most recent price data. Hence, that would mean setting it to periods less than 25 (< 25 periods).
While for long-term trading strategies, the aim is to look far away into the past price, and for this, we would set it to periods greater than 25 (> 25 periods).
Aroon Indicator Strategy
Aroon is a multifaceted trading indicator that possesses a lot of trade qualities that are built-in. It can on its own be utilized as a trading system.
Below are the leading trading strategies of the Aroon indicator and they can be used to gain an advantage.
#1. Aroon Breakout Trading Strategy
This strategy helps you identify consolidation and breakouts. When Aroon Up and Aroon Down lines are similar to each other, it is an indication that the price is consolidating.
The Aroon explanation is that there are no highs or lows that were made during the Levant period.
To trade consolidations there are two options. You can either remain patient for the breakout to occur and then move the trade in the direction of the breakout or wait for the Aroon crossover followed by a center line cross to input more confluence for the direction of the trade.
These Aroon signals usually happen before the main breakout, so you just have to await the breakout.
This is similar to front running all market participants. It gives you the advantage of entering the trade before anyone else.
READ ALSO: Financial Audit: All you need, Simplified!! (+ Detailed pdf)
#2. Aroon Trend Strength Strategy
This strategy will help you control the trend. The fundamental advantage of the trend can be disclosed through the Aroon lines.
When we reach 100, we start to notice little changes in the periods. The Aroon Up will simply hang, kind of like reaching a plateau.
This is similar to the activity that can be carried out when a traditional oscillator reaches overbought readings for a good amount of time.
The Aroon Up continues reading close to the 100 is a signal of a very strong trend. Although, at some point in time one or two of the following trade scenarios might occur.
- To anticipate a trend reversal
- To expect a pullback.
The Aroon type of this type of reading implies that these higher highs have been forming for a very long time.
Most times, these excessive readings on the Aroon oscillator signals the presence of a strong trend. All though, if you want to just scalp the market, you can leave your trade immediately the Aroon Up crosses below the centerline.
But if you want to trade with the trend, you have to come up with a tested and trusted way to tell the difference between a full reversal and a pullback.
They are called the law of effort vs. result. The effort can be defined as the task measured by the Aroon lines (in this case the Aroon Up. Here, the result is measured by the price action.
The assumption is that if the Aroon Up readjusts itself by going away from the 100 readings and moving towards the 0 readings, the price should follow the lead of the Aroon Up reading.
One would expect the effort that was put in to mean lower prices. It usually does not mean so, if we see that the change in the price is very little, we know that the strength of the Uptrend is very high.
This is how you can observe pullbacks with Aroon and trend trading.
#3. Crossover Strategy
This is one of the most important strategies using the Aroon indicator. In this strategy, a trader goes long whenever the Aroon Up line crosses above the Aroon down line.
On the contrary, they would go short whenever the Aroon down line crosses above the Aroon Up line.
There are no exit signals with this strategy other than the line crosses. This implies the strategy has maintained a trader in the market at all times.
READ ALSO: Straddle Options: Best Examples to Master any Strategy
Is the Aroon Indicator a Lagging Indicator?
It controls how long the price maintains its momentum following new highs or lows. With the Aroon Up and Aroon Down lines, it is clearly apparent on the indicator pane. Be aware that the Aroon indicator exhibits a small latency, similar to other indicators.
Is Aroon a Good Indicator?
The Aroon indicator may occasionally indicate a successful entry or exit, but other times it will give inaccurate or deceptive indications. When a significant price shift has already taken place, the buy or sell signal can come too late.
How Accurate Is the Aroon Indicator?
While used in conjunction with price action analysis, other technical indicators, and fundamental analysis when placing long-term trades, the Aroon indicator is most accurate and helpful.
Is There a Wyckoff Indicator?
Based on Wyckoff Logic and ideas, the Wave Indicators were developed. Wyckoff advised looking at market activity as a succession of waves to better comprehend it. You can find areas of supply and demand by using the Wave Indicators to view the markets as a continuous series of up and down movements.
Which Indicator Has Highest Accuracy?
The STC indicator is a leading, forward-looking indicator that, because it takes into account both time (cycles) and moving averages, delivers faster and more accurate alerts than earlier indications like the MACD.
Are Emas or Smas Better?
When compared to SMAs, EMAs are more responsive to the most recent price changes since they give recent data a higher weighting than older data. This makes EMA results more timely and helps to explain why the EMA is the preferred average among many traders.
Who Invented Aroon Indicator?
In order to detect significant price changes, they also keep an eye out for large movements above or below 50. Tushar Chande created the Aroon Oscillator in 1995 as a component of the Aroon Indicator system. Chande wanted the system to draw attention to transient trends.
Bottom Line
Although the Aroon indicator may look like a good entry or exit strategy, it sometimes gives off false or poor signals.
Hence, traders need to make use of other indicators, and market analysis tools to make more informed trading decisions.
In general, I hope this article gives you a better understanding of Aroon indicators.
FAQs
Is Aroon indicator accurate?
How accurate is it? The Aroon Indicator is a useful tool that can be used by traders to track stock price trends. While the lines may not catch a trend immediately, the results generally tend to be accurate and reliable.
What is the best indicator for trend reversal?
Aroon’ is an indicator used to measure the direction of market trends and spot potential reversals. All stocks go through uptrend and downtrend, much like the economy goes through boom and bust cycles.
Which indicator works best with ADX?
The ADX Indicator actually works best when combined with other technical indicators. One of the best combinations is with the Relative Strength Index or RSI. Because the ADX measures the intensity of the trend the RSI can help with entries and exits by giving a time-based component to the trend.
Recommendations
- STRATEGIC SOURCING PROCESS: Detailed Steps to Strategic sourcing
- Irrevocable Beneficiary: A Definitive Guide
- SMALL BUSINESS MANAGEMENT: Best Software for Small Business Management(+ Quick Guide & Tips)
- Single Step Income Statement: Definition, Examples,Comparisons &Format
- FAIR VALUE ACCOUNTING: Definition & Benefits of Fair Value Accounting