Although weekly or monthly data might provide useful information, it is crucial to take a longer and broader view of your company’s growth. Year-over-year growth is a valuable measure in this regard. Year-on-year growth allows you to measure genuine growth without the influences of seasonality, whether you’re looking at revenue, profit, production, or any other statistic.
This post will teach you how to calculate year-over-year growth with the formula for several measures. You will also learn how to utilize Google Sheets to create templates that will allow you to speed up computations and maintain track of all calculated values.
What is Year Over Year Growth?
Year-over-year (YOY) growth is a critical performance indicator that compares growth in one period (typically a month) to growth in the prior year’s similar period (thus the name). In contrast to solitary monthly measures, YOY provides a view of your performance that excludes seasonal influences, monthly volatility, and other factors. Over time, your genuine triumphs and obstacles become more apparent to you. This is, unsurprisingly, an important metric for retail analytics.
The first significant advantage of YOY growth is that it removes seasonality from your growth measurements. During the holiday season, most retailers notice a significant increase in sales. On a monthly basis, this can create the impression of huge growth. However, if these inflated numbers revert to normal levels after the holidays, they aren’t genuinely emblematic of growth over time.
When you compare similar times over time, you can get a more precise picture of your company’s growth. Here’s an illustration: For November, a 40% increase in monthly sales growth may appear to be a huge leap worthy of celebration. However, when compared to the previous year, when growth was 45%, this figure shows a mild decline rather than a jump. Without YOY growth comparisons to provide a baseline and historical context, you can only rely on the most current data. This is not a good strategy to make long-term decisions or drive long-term growth.
Read Also: YOY: Year-Over-Year Analysis, Growth and Investment Calculations, Formula & Examples
That isn’t to imply that year-over-year measurements are the be-all and end-all of analysis. Focusing on a 12-month timeframe may also provide you with a too-wide perspective. Combining a longer-term view with complimentary month-over-month and quarter-over-quarter statistics can help you assess various aspects of annual growth and see how your firm is performing in a variety of ways.
Revenue growth is only one aspect of YOY growth. You can track a variety of components of your growth, including conversions, average sale value, and other data that are related to, but not limited to, your bottom line.
Steps to Calculate Year-on-Year Growth
There are a few procedures you must take to calculate your company’s year-over-year growth.
#1. Determine why you’re seeing YOY growth.
First and foremost, you must identify which areas of your business you wish to see YOY growth in. Is it money? How many staff are there? What are marketing KPIs? When it comes to year-over-year growth, the globe is your oyster…So long as you have the data for your computations. Once you’ve determined why you’re calculating YOY growth, collect the data for both time periods you’re comparing. That brings us to…
#2. Select a time frame
Do you wish to calculate year-over-year growth between two months, quarters, or even years? You have an option. However, by selecting shorter time periods, such as months, you can help to reduce seasonality difficulties.
#3. Apply the formula for year-over-year growth.
It is not difficult to calculate year-over-year growth. After retrieving your data, you may quickly obtain results.
Subtract last year’s number from this year’s number to begin the equation. This will tell you the year’s total difference. If the number is positive, you won. If the number is negative, you lost money.
Then, divide the difference by the number from the previous year. This provides you with the rate of growth year over year.
Finally, multiply the value by 100 to convert it to a percentage to obtain the year-over-year percentage change.
Year-Over-Year Growth Formula
The following formula is used to calculate the year-over-year (YoY) growth rate.
Year over Year Growth (YoY) = (Current Period Value ÷ Prior Period Value) – 1
End of Period (EoP)
Beginning of Period (BoP) Prior Period
Year-on-Year Growth Calculation Example
For example, if a company’s revenue increased from $25 million in Year 0 to $30 million in Year 1, the formula for calculating the YoY growth rate is:
Year-on-Year Growth (%) = ($30 million / $25 million) – 1 = 20.0%
Another way to calculate YoY growth is to deduct the prior period balance from the current period balance and then divide the result by the prior period balance.
YoY Growth (%) = (30 million – $25 million) / $25 million = 20.0%
In any case, the year-over-year (YoY) growth rate equals 20.0%, which shows the difference between the two periods.
How Do You Calculate Year Over Year Growth In Excel or Google Sheets,?
As you can see, the calculation is straightforward; nevertheless, these calculations must be performed on a regular basis. Keep track of these variables ideally to avoid having to recalculate to gain a long-term view. Fortunately, technologies like Excel and Google Sheets can assist you in creating templates to track and automate calculations. If you use financial statement templates, you may easily enter YOY growth calculations. You can, however, create them as a separate template and import the information from the source file/s.
The following section contains examples of YOY growth calculations using Google Sheets.
Examples of Year-Over-Year Growth Calculations On Excel Sheet
The examples below are based on data from Company A. In the first example, I will calculate sales growth year over year. In the second example, I will calculate year-over-year growth for a number of relevant indicators.
Example 1: Year-Over-Year Growth for a Single Metric
- Choose a timeframe to work with. I’ll take December totals from 2020 and 2021 in this scenario.
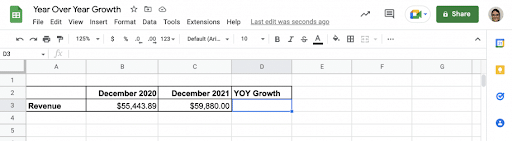
- Separate two sets of parentheses and subtract the old and new values. The initial pair of parentheses should be closed.
- Subtract the new value from the old value and close the second pair of parentheses.
- To calculate the percentage, multiply by 100.
That’s all. The YOY growth rate for December values is 8%.
Example 2: Year-on-Year Growth for Several Metrics
I’ll use data for Company A again, but this time I’ll include more metrics.
- For the indicators provided below, I will use December totals from 2020 and 2021.
2. I’ll add the formula for YOY growth utilizing cell references, just like in the previous example.
3. Finally, I’ll drag the formula down to retrieve the numbers for all of the measures.
What is the Importance of Year-Over-Year Growth For Small Businesses?
#1. It takes into account seasonality.
The primary reason businesses calculate the YoY growth rate of any indicator is to monitor long-term business performance while allowing for seasonal swings or market volatility that are beyond the company’s control.
Because certain organizations have peak and low seasons, comparing month-to-month or quarter-to-quarter numbers may be ineffective.
Many retail organizations, for example, record significant revenue growth during the fourth quarter due to the holiday season. While this is certainly a pleasant experience for a company, comparing sales from that quarter to revenue from other quarters that year may provide an inaccurate image of that company’s growth.
When we compare this December’s revenue to the previous December’s revenue, we eliminate seasonal swings from the equation and get an annualized, more realistic picture of growth.
You can be confident that the percentage changes you’re calculating are precise, unbiased, and reflective of your company’s actual financial health when you use YoY calculations.
#2. It provides a long-term view of performance.
In addition to removing variables that are outside your company’s control, YoY calculations are an excellent approach to tracking long-term business performance.
While tracking daily sales will give you a sense of how your firm is performing, annualizing a company’s performance simply provides a more complete picture of where your organization is and where it may improve.
Understanding Variance (Percent Change) in YoY Growth Analysis
The key advantage of YoY growth analysis is how simple it is to track and compare growth rates over multiple time periods, which, when annualized, removes the impact of monthly volatility.
Furthermore, any cyclical patterns will be visible if the historical results reflect the whole economic cycle.
While the intuition for the two fundamental criteria is simple, you must conduct additional research on the company’s growth trajectory to find the underlying sources of the change before reaching a final conclusion.
- Positive Year-On-Year Growth
- Negative Year-On-Year Growth
Consider a corporation whose sales growth rate in the previous year was 5%, but whose growth rate in the current year is only 3%.
Despite the slightly lower growth rate, the quality of revenue generated may have improved (e.g., long-term contractual revenue, less churn, lower client acquisition expenses).
Without a deeper dive examination, it would be inaccurate to presume that the current year was necessarily “worse” than the previous year.
Another crucial factor to remember is that all businesses’ growth will ultimately slow.
Mature firms with established market shares are less likely to fund growth and are more likely to concentrate on:
- Dividend Payments to Shareholders
- Increasing Operational Effectiveness
- Customer Retention vs New Customer Acquisition
Examples of Year-on-Year Growth in the Real World
YOY growth is important in retail, but other businesses can benefit from integrating these measurements in KPIs and analytics.
Although YOY growth is king in retail, many other industries can benefit from adding these metrics in KPIs and analytics. Examine the following instances to show how beneficial YOY growth can be:
- Healthcare: It’s critical to look at YOY results with varied policies when analyzing things like patients served or cost per patient. Observing how performance changes after implementing a new practice can reveal whether or not it was beneficial.
- Manufacturing: The efficiency of a factory’s production lines determines its survival. Measuring how much production rates increase or decrease over time is critical for understanding processes, machine performance, and a variety of other factors. Manufacturing analytics, which combines efficiency statistics with sales data, can help businesses better prepare for seasonal shifts and identify their long-term opportunities and problems.
- Logistics: In an industry defined by the number of products delivered and efficiency, year-over-year growth might indicate if a company is remaining efficient and effective in the market, or if performance is declining. When comparing delivery over time, it is possible to identify areas for improvement and tasks where simplifying functions could be advantageous.
What are Some Alternatives To Year-Over-Year Growth?
While year-over-year growth is a crucial calculation to consider for your company, it isn’t the only time-series indicator that can help you gain a better view of performance. You need additionally calculate the following:
- Month to date (MTD): calculates a KPI from the start of the current month until the current date, excluding today’s date.
- Quarter to Date (QTD): measures a KPI from the start of the quarter until the present date, excluding today.
- Month over month (MoM): the difference between this month’s (sales, users, etc.) total and the previous month’s total.
Conclusion
Year over Year Growth is a key financial measure. You can eliminate the effects of seasonality and volatility by using YOY growth. Instead of comparing February values to January levels, you compare them to the previous year’s February values. This provides a valuable value comparison, and because it is expressed as a percentage, it is also straightforward to compare with similar companies in the industry.
You now understand what year-over-year growth is and how to calculate it. You also know how to quickly create a Google Sheets template to calculate year-on-year growth for your chosen KPIs. As you can see, using Google Sheets to calculate YOY growth is simple. The computations are simple, but getting the values for various indicators on a regular basis might be time-consuming.
Related Articles
- YOY: Year-Over-Year Analysis, Growth and Investment Calculations, Formula & Examples
- WHAT IS GROWTH INVESTING: A Beginner’s Guide To Growth Investing
- FINANCIAL GROWTH: How Does Investing Promote It
- COMPANY CORE VALUES: Top 10 Core Values & How to Develop It
- BUSINESS GROWTH: 2023 Best Practices & Helpful Tips to Implement Now!!