Accounting, over the years, has become a tedious task for most business owners. While the process of accounting is beyond the scope of this article, we’ll go over a fraction of the process; marginal cost. This also covers the formula for marginal cost and how to calculate it; plus the easy way out using an excel template sheet.
What Is the Marginal Cost?
The incremental costs spent when producing additional units of a good or service are referred to as marginal costs. The overall change in the cost of manufacturing more items is divided by the change in the number of products manufactured to calculate the marginal cost.
Labor and materials, as well as any expected increases in fixed costs (if any), such as administration, overhead, and marketing expenses, are usually included in the computation. In financial modeling, the marginal cost formula can be used to optimize cash flow generation.
Understanding Marginal Cost
The marginal cost of production is a concept in economics and managerial accounting that is commonly utilized by businesses to determine the optimal production level. Manufacturers frequently consider how much it would cost to add one additional unit to their manufacturing plan. The benefit of creating one additional unit and receiving revenue from that item will lower the entire cost of producing the product line at a specific level of production. Finding that point or level as early as possible is crucial to lowering manufacturing costs.
All costs that fluctuate with the degree of production are included in the marginal cost of production. For instance, if a corporation needs to construct a completely new facility in order to produce more goods, the cost of doing so is a marginal cost. The number of marginal costs changes depending on the quantity of the product being manufactured.
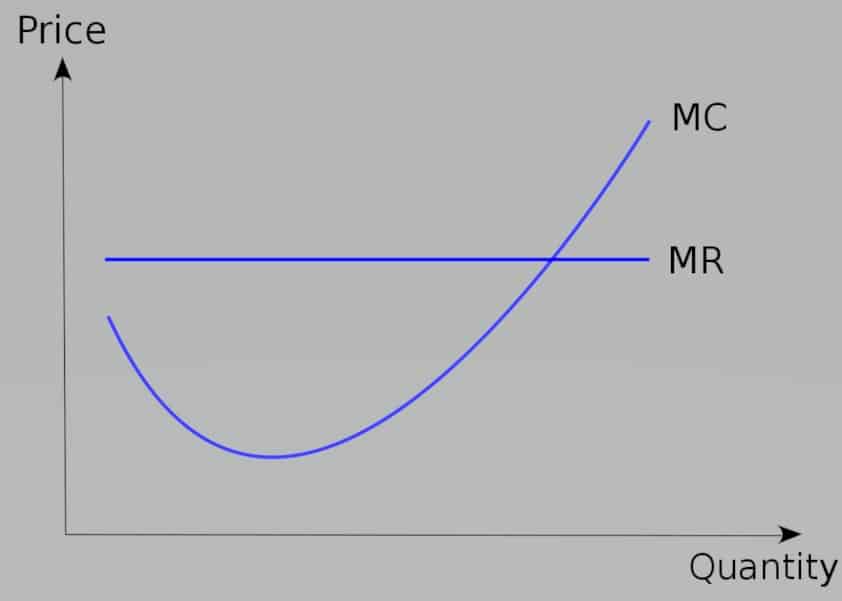
And because a corporation seeking to maximize profits would produce until the marginal cost (MC) equals marginal revenue (MR), marginal cost (MC) is an essential component in economic theory. After that, the cost of generating a new unit will outweigh the money generated.
Marginal Cost and Its Importance
In economics, marginal costs are essential because they help businesses maximize earnings. Profit maximization occurs when marginal costs and marginal income are equal. This occurs when the cost of producing an additional well is exactly equal to the revenue generated from its sale. In other words, the company is no longer profitable at that moment.
Marginal costs begin to decrease when the company benefits from economies of scale, as shown in the marginal cost curve below. However, marginal costs might start to rise when businesses become less productive and suffer from scale economies. It is at this time that costs rise to the point where they meet marginal revenue.
This could be as a result of the company growing too large and inefficient, or as a result of a management issue in which employees become demotivated and less productive. Whatever the reason, businesses can confront escalating costs which often lead to low production when their revenue equals their marginal cost.
The curve of Marginal Costs
In the manufacturing industry, marginal costs are critical because they influence the rate at which products should be halted. At a certain level of production, MR = MC, and the company is no longer profitable. Increasing output any further would therefore be counterproductive.
10 Key Features of Marginal Cost
The following are the main characteristics of marginal costing:
- Marginal cost is a pricing strategy or procedure that is used in conjunction with other costing methods (process or job).
- At every level, fixed and variable expenses are maintained separately. Fixed and variable expenses are further divided into semi-variable costs.
- Fixed expenses are excluded from product costs, production costs, and sales costs. Only variable costs are taken into account when calculating the product’s cost.
- When finished goods and work-in-progress evaluations are taken into consideration, only variable costs remain.
- Fixed costs are charged to the profit and loss account for the period in which they are incurred since they are period costs. They are not carried over to the following year’s earnings.
- The income or profit is defined as marginal income or marginal contribution.
- The net profit or loss is the difference between the contribution and fixed costs.
- Fixed costs are constant regardless of activity level.
- The variable cost per unit and the sales price remain unchanged.
- The cost-volume-profit relationship is completely utilized to disclose the profitability status at various levels of activity.
The formula for Marginal Cost
You can use the following marginal cost formula to understand how to calculate marginal cost:
Marginal Cost = Change in Total Cost / Change in Quantity
Let’s take a closer look at the two primary components of the marginal cost formula:
#1. Change in Total Cost
Your costs can rise or fall at any stage of manufacturing. Your manufacturing expenses will rise if you need to hire an extra worker or buy more raw materials to create more units, for example. Deduct the production cost of batch one from the production cost of batch two to see how much your production costs have changed.
#2. Change in Quantity
When you have different levels of production, volumes will naturally grow or decrease. You’ll need to subtract the number of goods from your first production run from the number of goods from the second, expanded production run to figure out the difference in numbers.
How to Calculate Marginal Cost Using Formula
The following are examples that would aid you to calculate the marginal cost.
Example 1
Monroes Motorbikes is a privately owned company owned by John Monroe. He produces and sells 10 motorcycles for $100,000 in his first year of business, which cost him $50,000 to produce. In his second year, he produces and sells 15 motorbikes for $150,000, despite the fact that they cost $75,000 to design.
We begin by calculating the change in overall cost. In this situation, the rise was from $50,000 to $75,000, a total increase of $25,000 in this circumstance. Then we calculate the change in quantity, which goes from ten to fifteen, a five-fold increase. The difference in the total price ($25,000) is then divided by the change in quantity (5), yielding a marginal cost of $5,000 per motorcycle.
Example 2
Bob Ryan is the owner of a bakery in the heart of London. Rent, as well as the cost of purchasing machinery, tills, and other equipment, are all fixed costs for him. Then there are the variable costs of staff, utility bills, and raw materials.
His total costs in the first year of operation are $100,000, with $80,000 in fixed costs and $20,000 in variable costs. He sells 50,000 items and earns $200,000 in the process.
Total costs rise to $120,000 in the second year of business, with $85,000 in fixed costs and $35,000 in variable costs. He sells 75,000 items and earns $300,000 in the process.
As we can see, fixed costs rise as output expands, necessitating the purchase of more equipment. As more people and raw resources are required, variable costs rise. Both of these factors add up to a cost increase of $20,000 in total. Simultaneously, the total number of things produced and sold rises by 25,000. To arrive at a cost of $0.80 per unit, divide the higher cost ($20,000) by the increased quantity (25,000).
Example 3
Julie Porter is the owner of a textile company that produces 200 dresses per year at a cost of $15,000 apiece. With an additional 20 dresses requested, she begins to see an uptick in demand. As a result, she wants to figure out if making these extra gowns is worthwhile.
She adds up the materials and other costs and discovers that making an extra 20 dresses will set her back $2,000. By dividing the costs by the quantity, these marginal costs can be calculated. So $2,000 divided by 20 equals $100 per gown.
In order for her to make a profit, she would have to demand that customers pay more than $100 for each dress.
Pricing based on Marginal Cost
When a selling corporation cuts the price of its items to equal marginal cost, this is known as marginal cost pricing. In other words, it lowers the price to the point where it no longer makes a profit. Typically, a company would do this if they are experiencing low demand and need to decrease prices to the marginal cost to get customers back.
Alternatively, the company may be cash-strapped and needs to swiftly sell its products in order to replenish its funds. It could be to cover an anticipated debt payment, or it could simply be due to a lack of funds. Simultaneously, it may use a marginal cost pricing technique to cut inventory, which is particularly frequent in the fashion industry.
Furthermore, this is a common tactic used by supermarkets. This could be done to get rid of out-of-date products or to entice buyers to buy cheap things. The idea is that while they’re in the store, they’ll buy other things that make the company money.
Read Also: Pricing Strategy: Best strategies to Maximize profit
What is the Significance of the Marginal Cost Equation & Formula?
For a variety of reasons, knowing how to calculate the marginal cost is essential. Most significantly, it gives you an understanding of your production schedule’s efficiency, allowing you to calculate when your organization will be able to attain economies of scale (i.e., cost efficiencies resulting in a decreased cost-per-unit). The faster you can achieve your ideal production level, the better for your company. Simply put, the corporation can profit if the marginal cost of producing one additional unit is less than the purchase price.
It’s also worth noting that if your company gets less productive and suffers from scale diseconomies, your marginal cost curve may begin to rise (i.e., the inverse of an economy of scale, wherein the business becomes too large, and poor communication, loss of control, and external opposition lead to a rise in per-unit costs). If the quantity of income you’re earning (marginal revenue) is equal to – or less than – the marginal cost, you’ll need to suspend manufacturing because the cost of production is costing the company money.
Key Factor: Marginal Cost (With Formula)
If it were up to them, every entrepreneur would want to make and sell an endless number of the product (s). In practice, however, this is not the case. There is usually a couple of factors that limit a company’s activity level. These often include; the key factor, limiting factor, governing factor, or principal factor.
In most cases, sales are the most important aspect in determining the volume of output to be generated. However, there may be instances where demand for the product is high but other resources, such as labor, machine capacity, material, finance, and so on, are scarce. In such cases, any element that restricts a firm’s volume of activity is regarded as the key factor, because the decision “how much to produce” is determined by it.
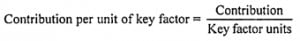
When sales are the key factor, the product’s profitability is calculated using the P/V ratio.
The following formula can be used to determine the profitability of any major element other than sales:
Important Formulas and Equations for Marginal Cost
The primary goal of a business is to make a profit, which is defined as the difference between sales and total costs.
Profits= Sales – Total Cost
Total cost, on the other hand, might be either constant or variable.
As a result, the fundamental equation has the following forms:
∴ Profit = Sales – (Variable Cost + Fixed Cost)
∴ Profit = Sales – Variable cost – Fixed cost
Therefore; Profit + Fixed cost = Sales – Variable cost.
This is the basic equation of marginal costing.
Both the expressions of Sales – Variable Cost and Profit + Fixed cost are technically termed as contributions.
∴ Sales – Variable Cost = Contribution = Fixed Cost + Profit
∴ Contribution – Fixed cost = Profit
Marginal Cost Formula in Excel (with excel template)
It’s often tedious to take the high road when it comes to calculating marginal cost as we will discuss later. But then there is often an easy way out using an excel sheet; more like a marginal cost calculator.
Let’s use the scenario in the following example to get a hang of how the excel below template works.
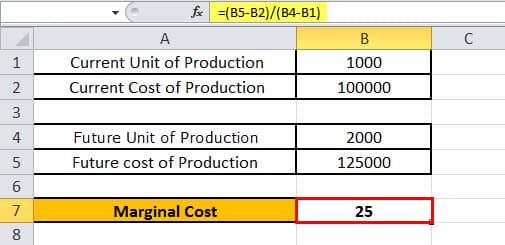
A manufacturing company’s present cost of production is $1,00,000 for 1000 pens, and its expected future output is 2000 pens at a cost of production of $1,25,000. As a result, the marginal cost will be calculated as 25.
The manufacturing company’s data is included in the template below for calculating purposes.
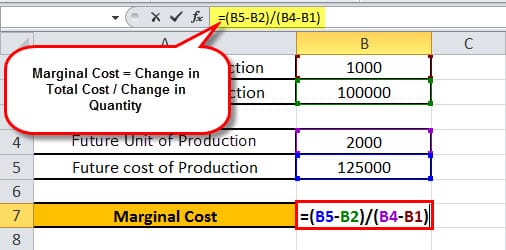
This gives us a total marginal cost calculation of;
Segregating Fixed and Variable Elements from Semi-variable Costs – Methods and Objectives
For the most part, separating fixed and variable expenses from semi-variable costs can be done in a variety of ways. They include the following:
Method #1: Activity Level Method
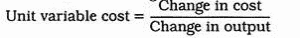
This technique takes semi-variable costs into account at two separate output levels. And because the change in cost represents a change in variable cost as a result of a change in production level, the unit variable cost is determined by dividing the difference in cost between two periods by the difference in output between the same periods.
To put it another way,
Method #2: Estimation Method
The relationship between cost and degree of activity is determined using this method in cooperation with someone who is knowledgeable about the conditions that cause it to occur.
The connection is constructed to indicate the cost that would follow if a department’s activity was decreased to a low or zero level. The fixed costs are then presumed to be fixed, and the remainder is assumed to be variable. Even though it is simple, this method is not particularly accurate.
Method #3: Analytical Method
The degree of variability is determined using this method; by examining the semi-variable costs carefully. The analysis calculates the degree of variability at various operational levels.
It divides the variable and fixed components on this basis. For example, at a certain level of output, the estimation might be that 30% is variable and 70% is fixed. Even this method isn’t precise because it’s completely random.
Method #4: High and Low Method
This method uses historical data to determine the cost-volume connection. As a result, it necessitates a review of earlier outcomes. This method considers the cost of a certain item of expenditure over a specified number of previous periods, as well as the level of activity. The latter can be quantified in terms of machine-hours.
The expenses associated with two extreme levels of activity are identified, and the rate of change between the two extremes is calculated. The variable cost per unit is expected to be this rate of change.
After that, multiply the level of activity by the variable cost per unit to get the total variable cost for one of the points. It is then subtracted from the total for that activity level. The remaining amount will be the fixed cost.
Method #5: Scattergraph Method
Drawing “the line of best fit,” is a straightforward statistical technique for separating fixed and variable aspects of semi-variable cost. We use past data in this method as well, but unlike the high/low point method, we use all of the data for a period.
The following are the steps in making a scatter graph:
- The horizontal axis should indicate output, sales, or machine hours, while the vertical axis should represent cost.
- Plot expenses at various levels of activity using the data provided.
- Draw a line that connects as many points as possible and has nearly the same number of points on both sides. Ignore the ones that indicate unusual outcomes. The line of best fit is the result of this process.
- Extend the line all the way to the vertical axis.
- The fixed cost element is indicated by the point where the line intersects the vertical axis. Draw a line parallel to the horizontal axis to represent fixed costs.
- The variable cost element for a given level of activity is indicated by the gap between the total cost line and the fixed cost line.
- Multiply the variable cost by the number of units for a given level of activity. This is the variable per-unit cost.
Method #6: Method of Least Squares
This is a statistical method for determining the best fit line. The equation of a straight line is used to represent a linear cost function and fit a straight line trend in this method, which is also known as regression analysis.
It is assumed that a line is best fitted to a set of data when the sum of the squares of the observed points’ deviations from the line is less than the sum of the squares of the deviations of any other line that could be drawn.
In the equation of a straight line y = a + box,
Where; y is the total cost, a is the fixed cost, x is the volume of output in units and b is the variable cost per unit.
To match a straight-line trend, it is important to find the values of a and b, which are constants in the equation. For this purpose, two equations, known as the normal equations of a straight-line trend, are required to be solved concurrently.
These normal equations are:

Since this method uses a mathematical mechanism, it is an accurate method of segregating the fixed and variable cost components. However, this strategy should only be used if there is a strong correlation between cost and activity.
Method #7: Engineering Estimates
If historical data is not available or if data is unreliable due to technological changes, statistical methods are limited. Even if historical data is available, if cost is influenced by a variety of factors, the relationship between cost and volume will be imperfect.
In such cases, industrial engineers and members of the accounting department work together to determine the physical inputs required to achieve certain output levels and then convert these into monetary costs. They not only distinguish between fixed and variable elements but also set efficiency standards for various levels of activity.
What Is Marginal Cost and Example?
Marginal Cost is the incremental costs spent when producing additional units of a good or service. For example, a manufacturing company’s present cost of production is $1,00,000 for 1000 pens, and its expected future output is 2000 pens at a cost of production of $1,25,000. As a result, the marginal cost will be calculated as 25.
What Is Meant by Marginal Cost?
The incremental costs involved in producing extra units are referred to as marginal costs in economics and accounting. The variable costs of production must be included in any marginal cost equation. Labor and supplies, for example, will need to be considered. However, if you need to increase your fixed costs to accommodate the additional output, you’ll just need to include the fixed costs of production (i.e., administrative costs, overheads, sales charges, and so on).
What Is Marginal Costing in Simple Words?
In simple terms, marginal costs are the incremental costs spent when producing additional units of a good or service. The overall change in the cost of manufacturing more items is divided by the change in the number of items produced to arrive at this figure.
What Is Fixed vs Marginal Cost?
Marginal costs are a function of total production costs, which include both fixed and variable costs. Fixed production costs are stable, occur on a regular basis, and do not alter in the near term when production varies. Rent and insurance payments, property taxes, and staff salaries are examples of fixed costs.