
One summer, I was drinking coffee with a friend who is a medical researcher. We were deep in discussion about a new cancer treatment that had recently made headlines. It was expected to be a game changer, with studies indicating that it greatly improved patient outcomes. Everyone was thrilled—doctors, patients, and even my friend’s colleagues. But my friend was not completely convinced. “Sure, it’s statistically significant,” he added, “but there’s more to it than just a low p-value.”
His comments grabbed my attention. I had heard the term “statistically significant” before, but his doubt made me realize that I may not have understood it correctly. As he talked, I realized that statistical significance is only one aspect of the greater picture. It can inform you if something is likely true, but it does not necessarily imply that it is significant.
This conversation inspired me to learn more about statistical significance, its importance, and how it is applied in research. Along the way, I realized that statistical significance is important for identifying whether a result is likely attributable to chance, but it is not a cure-all. Certain nuances and problems can make or break a study’s credibility.
In this article, I’ll share what I’ve learned about statistical significance, including its definition, why it’s important, how it’s calculated, and strategies for ensuring accuracy. I will also discuss some common misconceptions. By the end of this article, I believe you will have a better knowledge of statistical significance and how to apply it in real-world research and decision-making. Let’s dive in.
Key Points
- Statistical significance is a powerful tool to separate meaningful trends from random disturbances in your data. It helps you make data-driven decisions with confidence, avoiding wasted efforts based on insignificant fluctuations.
- Understanding statistical analysis techniques is vital: Familiarity with methods such as t-tests and ANOVA enables businesses to apply the right tools to their data analysis needs.
- Best practices for leveraging statistical significance include:
- Ensuring robust experimental design to control for confounding variables.
- Incorporating ongoing analysis and iteration to adapt your strategies based on new data.
- Investing in data literacy and training for your team to empower everyone to understand and leverage data.
- Embracing a culture of data experimentation to test new ideas and identify what works best.
- Promoting collaboration between data analysts and business stakeholders to combine technical expertise with business context.
- Utilizing data visualization tools to present findings clearly and understandably.
- Focus on continuous improvement by regularly monitoring results and refining your strategies.
What is Statistical Significance?
Statistical significance is a concept in statistics that determines whether the results of a study or experiment are likely to be true and not simply the result of chance. In layman’s terms, it assists researchers in determining whether a given finding is significant or if it occurred by chance.
The p-value, which reflects the likelihood that the observed result would occur if there were no actual effect or difference (the “null hypothesis”), is the most commonly used statistical significance metric. A p-value of 0.05 is a universally accepted level of statistical significance. If the p-value is less than this level, the result is regarded as statistically significant, implying a low likelihood that it occurred by chance.
The two principal components of this are its sample size and effect size. This means that, if you reach a certain level of confidence in the outcome of statistical hypothesis testing, the conclusion of a data set may be deemed statistically significant.
Understanding Statistical Significance

To put it simply, it’s a fancy way of saying that we can determine whether the patterns we see in our data are real patterns or just the result of chance.
imagine yourself in a game house. The roulette wheel is spinning while you watch. Black, black, black, red… Seems almost pointless, doesn’t it? For a moment, think of the following instance: the ball lands on red ten times in a row. That unpredictability seems a little strange now. Maybe the wheel is weighted, or maybe the dealer has a special trick for flicking the ball just right.
Now, that illustration, is what statistical significance is all about. It enables us to distinguish between true patterns hidden in our data and random variations. It functions similarly to a magic filter, separating the random fluctuations from the important trends.
Here’s how it functions: you suddenly witness a tiny increase in website traffic after launching an amazing marketing campaign. Is this an indication of the success of your campaign, or was it an exception? Answering that query is made easier by statistical significance.
As a result, we make use of a hypothesis testing theory. That is to say, we start with a null hypothesis, which says, “These two things (e.g., website traffic before and after the campaign) probably don’t differ from one another.” Then, a statistical test is then performed, and a p-value is ascertained. With that, the probability that the observed difference could be the product of random variation is indicated by the p-value.
Why Does Statistical Significance Matter in Business?

Statistical significance is important because it allows academics, policymakers, and regular people to make informed judgments. It is critical to assess whether a new treatment is effective, if a teaching approach works, or if a policy has measurable consequences. It aids in distinguishing true impacts from random changes in data, providing a clearer picture of what is truly happening.
In medicine, statistical significance might make the difference between approving or rejecting a new treatment. In the social sciences, it aids in determining whether a new intervention has a genuine influence on people’s lives. Essentially, it is a critical instrument for evidence-based decision-making.
imagine you observe a little drop in sales of a particular product and decide to discontinue it. despite this, what if that decrease was simply a disturbance at random? It’s conceivable you tossed away a perfectly good product! In the same way, statistical significance gives you the confidence you need to make data-driven decisions that don’t leave you wondering, “What if?” In addition to that, you will avoid making impulsive selections and focus on trends that have actual impact.
This is just one example of how businesses can make use of statistical significance. In addition to the above, statistical significance matters because it helps you know that the changes you’ve implemented can be positively attributed to various metrics.
The Process of Utilizing Statistical Significance
By now, you’re probably thinking that statistical significance is quite great. But how can I use it to achieve those fantastic business successes (and potentially impress everyone at the next marketing meeting)?” Prepare yourself, because using statistical significance to convert your data into usable insights necessitates a few key steps. Now, allow me to walk you through my tried and true ways.
Read Also: Statistical Tests: What They Mean, Examples, and Types
#1. Formulate a Clear Hypothesis
This is where researchers define what they’re testing. The null hypothesis typically states that there’s no effect or difference, while the alternative hypothesis suggests there is one. Think of this as gathering the ingredients required to prepare your dish. Finding the information you need to answer your inquiry is the first step.
Perhaps you’re curious about if a specific social media ad resonates with your target audience, or whether the introduction of a new product will result in increased sales. Once you’ve determined what you want, you must ensure that the data is ready for analysis and clean. That may include eliminating any errors or differences, such as duplicate entries or missing values.
#2. Start Collecting Your Data
Researchers gather data through experiments or studies. you’ve selected what you want to test, it’s time to start collecting data. You should choose a sample size because the goal of this test is likely to discover the best piece of content to use moving ahead. When it comes to landing pages, this could mean setting a certain time limit for your test (for example, leaving your page up for three days).
#3. Statistical Analysis Techniques
Choosing the right approach for your data is increasingly crucial. This is because there are numerous statistical tests available, each with advantages and limitations. Common tests include ANOVAs, which can compare means across many groups, and t-tests, which can compare means between two groups.
Although, the type of data you have and the question you want to answer will determine which test is right for you. You don’t have to become an experienced statistician overnight, so don’t worry. Also, choosing the correct test for your needs is made easier by a variety of user-friendly data analysis tools and online resources. Whilst internet calculators are accessible to perform calculations for you, it is always important to understand the underlying concepts.
#4. Calculate the Standard Deviation
The video will help too for a better understanding, mathematics can be difficult sometimes, right? right
Here, you’ll need to calculate the standard deviation. To this, you’ll use the following formula:
standard deviation = √((∑|x−μ|^ 2) / (N-1))
where:
∑ = the sum of the data
x = individual data
μ = the data’s mean for each group
N = the total sample
As much as performing this calculation will let you know how to spread out your measurements about the mean or expected value. If you have more than one sample group, you’ll also need to know the variance between the sample groups.
Next, you’ll need to use the standard error formula. For our purposes, let’s say you have two standard deviations for your two groups. The standard error formula is as follows:
standard error = √((s1/N1) + (s2/N2))
where:
s1 = the standard deviation of your first group
N1 = group one’s sample size
s2 = the standard deviation of your second group
N2 = group two’s sample size
#5. Interpreting Results
You’ll then need to do a power analysis to determine your sample size. A power analysis involves the effect size, sample size, significance level, and statistical power.
Once you’ve run your statistical test, it’s time to decipher the results. Here are two key things to pay attention to:
- P-values: Remember that magic number we talked about earlier? The p-value tells you the probability of observing a difference as extreme as the one you saw, assuming there’s truly no underlying effect (remember the null hypothesis?). A p-value of 0.05 or lower suggests it’s unlikely your results are due to chance alone.
- Confidence Intervals: These provide a range within which the true effect size likely falls. Think of it like a target – the bullseye is the most likely value, but the entire target represents the range of possible outcomes based on your data.
#6. Communicate Results Effectively
Take care not to simply send your coworkers spreadsheets that appear to have been created by an overly excited confetti machine, instead complete with charts and numbers. Provide a clear, practical explanation of your findings so that even colleagues who are not data literate can understand them. You can also, tell the story of your data with visual aids like dashboards and graphs. Think of infographics instead of confusing scatterplots. The goal is to make your insights clear, concise, and, even engaging!
#7. Drawing Actionable Insights
Researchers can implement insights because they have statistical significance working in our favor. The possibilities are infinite, ranging from modifying pricing methods in response to demand trends to optimizing inventory levels to reduce stockouts. Nothing is more fulfilling, I can assure you, than witnessing the fruits of your data-driven judgments materialize in the real world. Here’s how to use such statistical results to inform practical business decisions:
- Focus on statistically significant results: Don’t get carried away by trends that might just be random distractions. Focus on the findings with strong statistical backing to inform your strategies.
- Consider the effect size: A statistically significant difference might be small and not very impactful from a business perspective. Look at the confidence intervals to gauge the magnitude of the effect.
- Think about the context: Statistical significance tells you something is happening, but it doesn’t always tell you why. Consider other factors that might be influencing your results to draw meaningful conclusions.
In other words, by taking into account all of these factors, you can turn your statistical findings into a clear call to action for your website optimization approach.
Statistical Significance: Challenges and Considerations
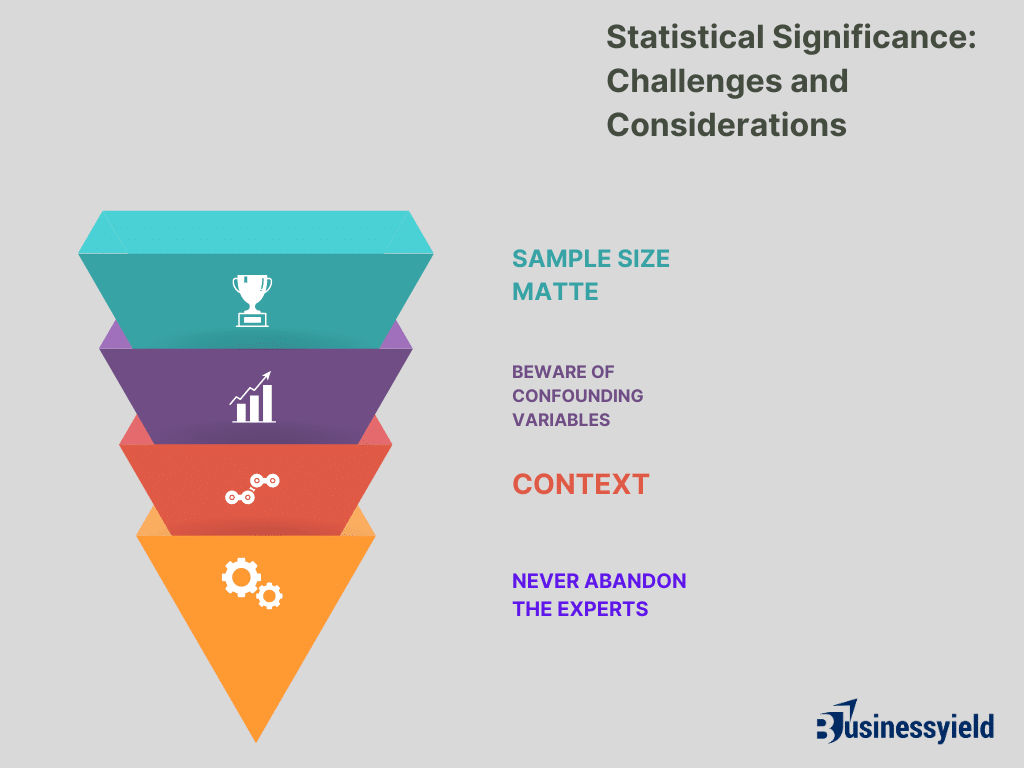
Of course, things do not always go smoothly. Along our journey, we’ll face a variety of problems, ranging from data discrepancies to algorithmic prejudice. But that’s what makes things fascinating, right? This is because we can overcome every difficulty that arises if we remain watchful and constantly refine our approach. In other words, statistical significance is an effective tool, but it is not a miracle cure. Here are a few things to keep in mind:
#1. Sample Size Matters
Think about flipping the coin ten times. You get five heads and five tails. Isn’t it pretty even? Imagine flipping it 1,000 times. The ratio may be considerably closer to 50-50. Likewise, the size of your data sample can influence the reliability of your statistical tests. In general, the bigger the sample size, the more certain you can be of the results.
#2. Beware of Confounding Variables
Assume you see an increase in sales after launching a new social media campaign. Cheers! But wait a minute. Was there another factor at work or did the campaign itself generate the rise in sales? Perhaps a competitor simply went out of business, or perhaps a national holiday increased sales overall. Factors causing are these extraneous elements that can distort your results. So, when analyzing your data, consider possible confounders.
#3. Context
Statistical significance can indicate whether or not something is occurring, but it can’t necessarily explain why. But, if one region just happens to have a higher population than the other, then a statistically significant difference in website traffic between the two regions could not indicate all that much. In essence, when concluding, keep the context of your data and business environment in mind at all times.
#4. Never Abandon the Experts
Although this article provides a strong basis, statistical analysis can become complicated, particularly when dealing with complex situations or huge datasets. So, Do not be reluctant to seek advice from a statistician or data analyst if you are faced with these circumstances. This is because they can assist you in selecting appropriate procedures, interpreting your findings, and avoiding common statistical mistakes.
Best Practices for Leveraging Statistical Significance
So what is the secret sauce for success in the statistical significance sector? To avoid common pitfalls and ensure the accuracy of results, researchers should consider the following strategies:
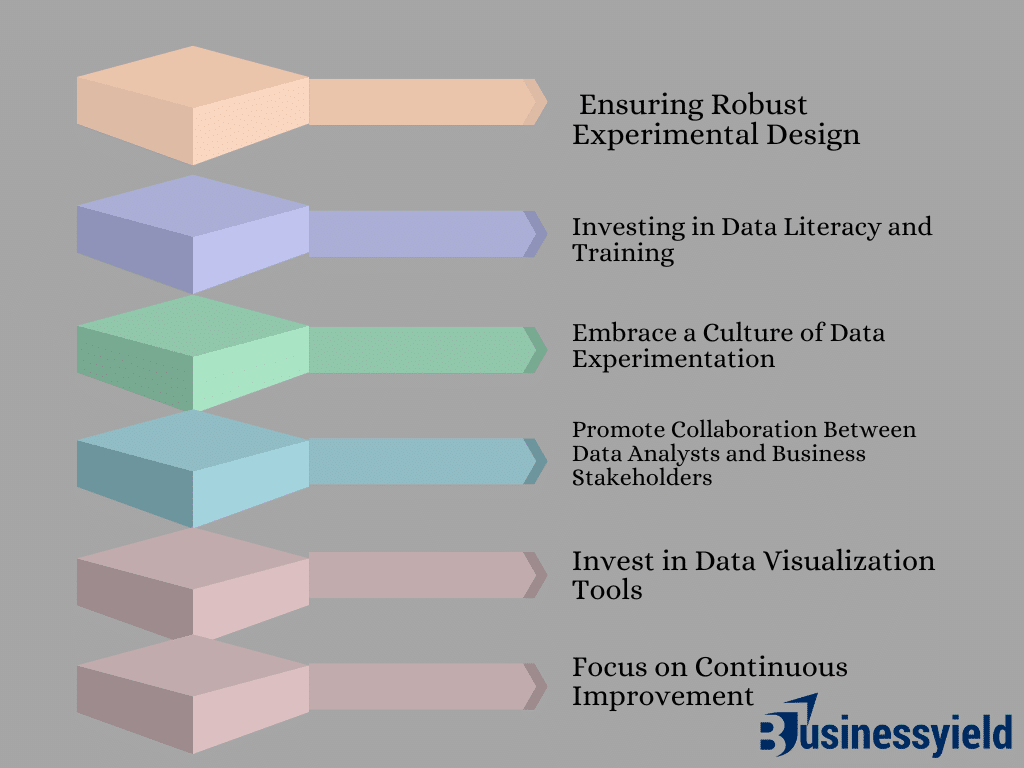
#1. Ensuring Robust Experimental Design
To get the most out of statistical significance, we need to start with a solid foundation. That means ensuring robust experimental design and methodology from the get-go. This might involve using techniques like random assignment to groups or carefully defining test parameters. It’s like building a house – you need a strong foundation to support the structure above.
#2. Investing in Data Literacy and Training
You need to invest in data literacy and training for all stakeholders throughout the organization. From leaders to front-line staff, everyone is involved in data-driven decision-making. It’s similar to giving everyone a seat at the table: the more people who understand the data, the more prepared you’ll be to make informed decisions.
#3. Embrace a Culture of Data Experimentation
Don’t be scared to try new ideas and techniques. A/B testing, along with other experimental methods, enables you to collect data and determine what performs best in a controlled setting. The statistical significance allows you to decide whether the observed effects are genuinely relevant or simply random chance. This is because Developing an experimenting culture allows you to continuously optimize your strategy and stay ahead of the game.
#4. Promote Collaboration Between Data Analysts and Business Stakeholders
The most efficient data analysis occurs when data analysts and business stakeholders communicate and collaborate openly. This is because analysts can contribute technical competence and statistical information, whereas business stakeholders bring domain knowledge and context to the table. In turn, this cooperative strategy ensures that statistical findings are turned into practical insights relevant to the business’s specific goals and issues.
#5. Invest in Data Visualization Tools
Complex data can be daunting and difficult to understand. Still, Data visualization tools can help you communicate your findings in a clear, simple, and visually appealing manner. Also, charts, graphs, and other visual features can help stakeholders grasp the story your data tells, even if they lack a strong statistical background.
#6. Focus on Continuous Improvement
Data analysis is an ongoing process. Regularly track your results and use them to improve your methods. Remember that just as the world of business changes, so should your data analysis. This means Developing a cycle of continuous improvement ensures that your data-driven decisions remain relevant and effective over time.
Following these best practices will ensure that you are effectively exploiting statistical significance to produce real commercial benefits.
Putting Statistical Significance into Action
Let’s see some real-world examples of how businesses have harnessed the power of statistical significance:
Case Study 1: Optimized Marketing Campaigns
A garment wholesaler employed A/B testing and statistical analysis to determine the impact of various email subject lines in marketing campaigns. By focusing on statistically significant differences in click-through rates, they were able to discover the subject lines that were most effective with their target group, resulting in a considerable boost in website traffic and sales.
Case Study 2: Improving the Customer Experience
A streaming service used statistical analysis to identify customer segments with high churn rates (cancellations). By evaluating user behavior and interests within these segments, they were able to provide targeted interventions such as tailored suggestions or special content offerings. This statistically significant decrease in loss enabled the streaming service to retain more consumers and increase its long-term profitability.
These are just a few examples, but they showcase how statistical significance can be used to inform data-driven decision-making across various industries. By following the steps outlined in this article and considering the best practices, you can unlock the hidden insights within your data and transform them into a competitive advantage for your business.
What Is P-Value?
A p-value is a measure of the probability that an observed difference could have occurred just by random chance.
What is no statistical significance?
The results are judged “statistically non-significant” if the analysis demonstrates that differences as large as (or larger than) the observed difference would occur by chance more than once in twenty times (p > 0.05).
What is a statistically significant p-value?
Statistically significant (P < 0.05) findings are assumed to result from real treatment effects ignoring the fact that 1 in 20 comparisons of effects in which the null hypothesis is true will result in significant findings (P < 0.05).
How do you know if the results are statistically significant?
A study is statistically significant if its P value is less than the predetermined alpha. Simply put, a P value smaller than a predefined alpha indicates a statistically significant result. A P value greater than or equal to alpha does not indicate a statistically significant outcome.
Conclusion
Statistical significance is a key concept for determining whether results are meaningful or simply a product of chance. This means you can have better traverse scientific studies and make educated decisions if you comprehend their definition, importance, and procedure, as well as use important tactics for proper analysis. Remember that, while statistical significance is important, it is not the only way to assess the usefulness of a study. Effect size, confidence intervals, and replication are all important considerations when determining a result’s true significance.
As a result, I challenge you to do a more thorough examination of your company procedures. Do you make full use of statistical significance? Are you giving your staff the right resources and training they need to make data-driven decisions? If not, now is the perfect time to get started.
References
- investopedia.com
- indeed.com
- blog.hubspot.com
- optimizely.com