As we continue to hear about an approaching recession and rising investor dissatisfaction, you may be wondering how these gloomy expectations affect the stock market.
This type of market sentiment exists at all stages of the market cycle, but just as understanding how inflation affects the stock market is important, understanding how investor consensus can generate price swings and volatility is essential for keeping your portfolio profitable regardless of market conditions. It’s also vital for staying sane during these trying times.
So, what exactly is stock sentiment, and how does it influence what happens in the markets? To begin, let’s agree on a definition of market sentiment.
What is Market Sentiment?
Market sentiment, often known as investor sentiment, refers to investors’ general outlook or attitude toward certain securities or the wider financial market. The aggregate price patterns reflect market participants’ optimism or pessimism.
Understanding Market Sentiment
Stocks tend to continue moving in the same direction as their current price during the short term. So if they’re rising, they’ll keep rising. Trading based on this information is known as trend following or momentum trading.
Of all, nothing stays in the same direction forever, so if you can assess trader sentiment, you might be able to predict when the trend will reverse.
Long-term investors (such as The Motley Fool) make investment decisions that are unaffected by market sentiment. It is feasible that a high-flying growth stock with strong positive sentiment will be an excellent buy, as could a despised value stock with a strong bearish sentiment.
Remember that positive sentiment indicates that the stock (or market) is projected to rise in the short term, while bearish sentiment indicates the opposite.
Market sentiment has a psychological component as well. Bullish sentiment is frequently accompanied by greed, while bearish sentiment is associated with fear. Warren Buffett, a well-known long-term investor, has stated that it is better to be scared when others are greedy, and greedy when others are fearful. Buffett is a value investor, and value investors are more likely to be contrarian.
What Effect Does Market Sentiment Have on Prices?
Sentiment influences demand and supply, which in turn influences price changes. When prices are rising, market sentiment is bullish; when prices are decreasing, market sentiment is pessimistic. Traders use market sentiment indicators in conjunction with trading frameworks or other forms of analysis to refine entry and exit signals. The key to maximizing returns is for an investor to correctly gauge the mood and act on it as soon as possible.
#1. Behavioral Finance Theory
Kahneman and Tversky’s Behavioral Financial Theory reveals several sorts of psychologically-grounded investor “irrationality.” There is mounting evidence that investors are boundedly rational, and their judgments are frequently governed by their own world perceptions or the decisions of other investors rather than by basic laws.
Investors’ cognitive and emotional biases, such as overconfidence in their ability to forecast, reliance on the rule of thumbs in investment allocation, difficulty adjusting their views to new information, and excessive reliance on past performance, all play a significant role in determining market behavior, frequently leading to biased investing decisions.
#2. The Animal Spirit Theory
Under uncertainty, humans are governed by their instinct, and their behaviors are dictated by their sentiments, according to John Maynard Keynes’ Animal Spirit Theory. When the market is on a roll, investors rush to it, expecting ever-increasingly speculative gains, and allocate their portfolios accordingly.
When the inevitable downturn occurs, investors will become increasingly gloomy but, unexpectedly, will continue to cling to their hazardous holdings in order to prevent realizing losses. Thus, herd behavior is inextricably tied to market sentiment and may allow for irrational exuberance, which is frequently reflected in inefficient prices and bubbles.
Strategies for Trading Based on Market Sentiment
Trading in sync with existing market feelings is the most prevalent reading of market sentiments, which is an effective technique for long-term investors. When market sentiment is positive, the prices of securities such as stock are predicted to rise, resulting in future capital gains and consistent dividend payments. It is usually referred to as herd behavior, and it results in the production of bubbles as a result of the free-rider effect.
Herd instinct, on the other hand, is not always a sound investment approach. There are also investors that trade in opposition to market sentiment. In times of excessive pessimism, they seek out beaten-down equities that have good fundamentals and promise enormous future growth potential but are accessible at a discount.
Similarly, value investors believe that short-term price swings do not adequately describe a company’s fundamental success. Because markets have a tendency to overreact to positive or bad news. Value investors seek equities that are currently cheap in relation to their company’s intrinsic value.
Indicators for Market Sentiment
#1. The VIX index
Option prices drive the VIX, commonly known as the fear index. A rising VIX indicates a greater market requirement for insurance. If traders feel the need to hedge against risk, this is an indication of rising volatility. Traders use moving averages to evaluate whether the VIX is comparatively high or low.
#2. The High-Low Scale
The high-low index compares the number of stocks that have reached 52-week highs to the number of stocks that have reached 52-week lows. When the index falls below 30, stock prices are near their lows and investors have a pessimistic market sentiment. When the index rises above 70, stock prices are approaching their highs, and investors have an optimistic market sentiment. Traders typically use the indicator in conjunction with a certain underlying index, such as the S&P 500, Nasdaq 100, or NYSE Composite.
#3. Positive Percentage Index
The bullish percent index (BPI) counts the number of equities that exhibit bullish patterns on point-and-figure charts. The bullish ratio in neutral markets is roughly 50%. When the BPI is at 80% or greater, market sentiment is exceptionally positive, and equities are likely overbought. Similarly, when it falls below 20%, market sentiment is negative and implies an oversold market.
#4. Moving Averages
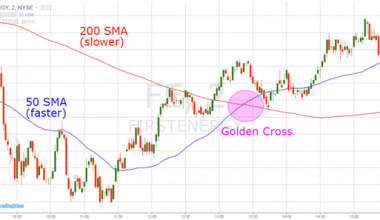
When gauging market sentiment, investors often utilize the 50-day and 200-day simple moving averages (SMAs).
When the 50-day simple moving average crosses above the 200-day simple moving average, this is referred to as a “golden cross,” and it signals that momentum has switched upward, creating bullish sentiment. So, when the 50-day SMA crosses below the 200-day SMA, this is referred to as a “death cross,” and it indicates lower prices, causing bearish sentiment.
Market Sentiment in the Real World
When multiple variables conspired to unnerve investors in December 2018, market sentiment became gloomy. First, concerns about declining corporate earnings grew. After several years of double-digit earnings growth for several S&P 500 businesses, many analysts expected that earnings would rise by only 3-4% in 2019.
At his monthly press conference, Federal Reserve Chair Jerome Powell fueled those anxieties by saying the central bank’s balance sheet runoff was on autopilot. His words were interpreted by the market as “hawkish” and unaccommodating for a slowing economy, further dampening market sentiment.
Finally, unresolved trade tensions between the United States and China, which saw tit-for-tat tariffs placed by the world’s two largest economies throughout 2018, as well as a U.S. government shutdown, exacerbated market sentiment over the month.
Bearish sentiment harmed investor confidence, resulting in the stock market’s worst December performance since 1931. The broad-based S&P 500 index sank 9.2% in one month, while the Dow Jones Industrial Index (DJIA), which includes 30 industrial bellwether companies, fell 8.7%.
The S&P 500 High-Low index went below 30 in late December and remained near zero until mid-January, demonstrating the market’s pessimistic sentiment at the time.
Can You Analyse Stock Market Sentiment?
The good news is that, while stock market sentiment among investors is not necessarily based on fundamentals, there are a number of indicators that professionals use to get a decent read on how investors feel about the equities market.
People’s investing methods will determine how they assess stock market sentiment and what investment decisions they make based on it. Swing traders, for example, may look for technical indicators such as hints of new volatility or stability that might assist them exit and join positions profitably, given how swing trading works.
Investors, on the other hand, can limit the risk of options trading by studying investor sentiment. Investors may make the necessary trades to keep their portfolios profitable and execute a new strategy based on current market conditions and investor consensus with an early indicator of negative or optimistic sentiment.
Furthermore, contrarian investors may examine current market sentiment and trade in the opposite direction of the overwhelming opinion. For example, if investor sentiment toward a particular asset is pessimistic, contrarians will buy the equity instead.
How Can You Analyse Market Sentiment Toward an Individual Stock?
Individual stocks often move independently of bigger trends, thus it is equally crucial to be able to gauge market sentiment on a stock-by-stock basis, regardless of how the market is doing overall.
Analyzing longer-term sentiment can be as simple as glancing at a stock’s chart to determine if it’s in an uptrend, a downtrend, or has been bouncing around between support and resistance for a while, but the following indicators can help with insights into a stock’s shorter-term market sentiment.
#1. Short Term Interest
When someone shorts a stock, they borrow and sell it right away, anticipating the price will fall before they have to repurchase it and return it to their lender.
Short interest in a stock is the percentage of its floating shares (those accessible for public trade) that are currently sold short. In other words, it is the proportion of a stock’s available shares that are now employed to bet against its performance.
Low short interest suggests that few investors are confident enough in a stock’s potential drop to bet against it, whereas high short interest signals unfavorable market sentiment.
#2. Put-to-Call Ratio
Looking at open options contracts is another technique to assess sentiment toward a specific stock. Put options allow their owners to sell a stock at a specific price by a specific expiration date, so their value rises as the underlying stock falls in price. Call options, on the other hand, offer their owners the right to buy a stock at a specific price before a specific expiration date, and their value rises as the underlying stock rises in price.
Put options are typically bearish, while call options are typically bullish. A stock’s put-to-call ratio compares a stock’s recent put option purchase volume to its recent call option purchase volume.
A result of 1 implies that put and call volume are almost equal, or that investors’ sentiment toward the stock in issue is fairly evenly split. Lower values indicate that there are fewer puts than calls, which is bullish, while higher readings indicate that there are fewer calls than puts, which is bearish.
Summary
Market sentiment, often known as investor sentiment, refers to investors’ general outlook or attitude toward certain securities or the wider financial market.
The Animal Spirit Theory by Keynes and the Behavioural Theory of Finance by Kahneman and Tversky demonstrate how sentiment drives demand and supply.
Market sentiment is gauged using indicators such as the VIX, High-Low Index, Bullish Percentage Index, and Moving Average.
Related Articles
- SENTIMENT ANALYSIS: Meaning, Examples, Tools & What You Should Know
- Financial Performance: A Comprehensive Guide For Any Business(+ quick tools)
- Stock Valuation: Overview, & Effective Valuation Methods